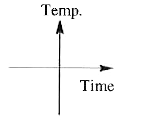
A
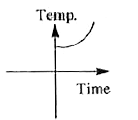
B
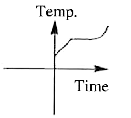
C
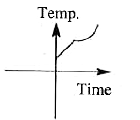
D
Text Solution
Verified by Experts
The correct Answer is:


Similar Questions
Explore conceptually related problems
Recommended Questions
- Liquid oxygen at 50 K is heated to 300 K at constant pressure of 1 atm...
Text Solution
|
- If liquefied oxygen at 1 atmospheric pressure is heated from 50K to 30...
Text Solution
|
- Liquid oxygen at 50 K is heated to 300 K at constant pressure of 1 atm...
Text Solution
|
- 50 K ताप पर द्रव ऑक्सीजन को 300 K तक एक वायुमंडलीय स्थिर दाब पर गर्म क...
Text Solution
|
- 1 वायुमण्डल के स्थिर दाब पर द्रव्य ऑक्सीजन (Liquid oxygen) का ताप 50 क...
Text Solution
|
- Liquid oxygen at 50 K is heated to 300 K at constant pressure of 1 atm...
Text Solution
|
- Liquid oxygen at 50 K is heated to 300 K at constant pressure of 1 atm...
Text Solution
|
- If liquefied oxygen at 1 atmospheric pressure is heated from 50K to 30...
Text Solution
|
- Liquid oxygen at 50 K is heated to 300 K at constant pressure of 1 atm...
Text Solution
|