Text Solution
Verified by Experts


Topper's Solved these Questions
II PUC PHYSICS (P.U. BOARD LATEST MODEL QUESTIONS PAPER -2)
SUNSTAR PUBLICATION|Exercise PART-B|8 VideosII PUC PHYSICS (P.U. BOARD LATEST MODEL QUESTIONS PAPER -2)
SUNSTAR PUBLICATION|Exercise PART-C|8 VideosANNUAL EXAM QUESTION PAPER MARCH-2020
SUNSTAR PUBLICATION|Exercise Part-D|11 VideosII PUC PHYSICS (ANNUAL EXAM QUESTION PAPER MARCH - 2019)
SUNSTAR PUBLICATION|Exercise PART - A|37 Videos
Similar Questions
Explore conceptually related problems
SUNSTAR PUBLICATION-II PUC PHYSICS (P.U. BOARD LATEST MODEL QUESTIONS PAPER -2)-PART-D
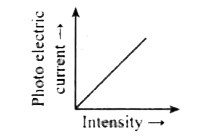
- Represent graphically the variation of photoelectric current with the ...
Text Solution
|
- State Gauss theorem in electrostatics. Derive the expression for elect...
Text Solution
|
- Obtain an expression for the equivalent emf and internal resistance of...
Text Solution
|
- Describe the construction and working of an AC generator and arrive at...
Text Solution
|
- Derive n= (sin ""(A+D)/(2))/( sin ""(A)/(2)) for the prism. Where the...
Text Solution
|
- Writer Bohr's postulates for the hydrogen atom model.
Text Solution
|
- with a suitable circuit explain the action of a transistor as ...
Text Solution
|
- A900pF capacitor is charged by 100 V sources .Calculate the electr...
Text Solution
|
- A pointer galvanometer with a scale of 30 divisions has a resi...
Text Solution
|
- A resistor and a capacitor are connected in series to a 50 Hz ac s...
Text Solution
|
- double -convex lens is to be manufactured from a glass of refra...
Text Solution
|
- Calculate the energy released in the reaction ""(92)^(235)U +""(0)^...
Text Solution
|