Text Solution
Verified by Experts


Topper's Solved these Questions
II PUC PHYSICS (P.U. BOARD LATEST MODEL QUESTIONS PAPER -2)
SUNSTAR PUBLICATION|Exercise PART-D|11 VideosII PUC PHYSICS (P.U. BOARD LATEST MODEL QUESTIONS PAPER -2)
SUNSTAR PUBLICATION|Exercise PART-B|8 VideosANNUAL EXAM QUESTION PAPER MARCH-2020
SUNSTAR PUBLICATION|Exercise Part-D|11 VideosII PUC PHYSICS (ANNUAL EXAM QUESTION PAPER MARCH - 2019)
SUNSTAR PUBLICATION|Exercise PART - A|37 Videos
Similar Questions
Explore conceptually related problems
SUNSTAR PUBLICATION-II PUC PHYSICS (P.U. BOARD LATEST MODEL QUESTIONS PAPER -2)-PART-C
- Derive the expression for torque on an electric dipole placed in a uni...
Text Solution
|
- What is an equipotential surface? Draw the equipotential surfaces for ...
Text Solution
|
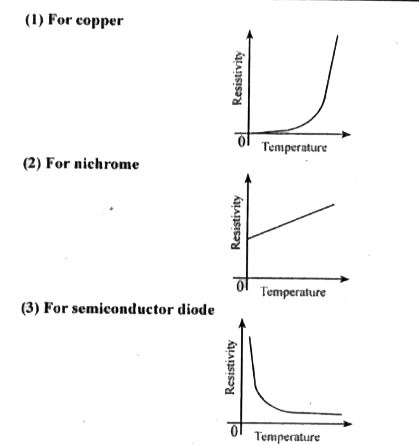
- Draw the graphs representing the variation of resistivity with tempera...
Text Solution
|
- Define the term .angle of dip.. Find the value of dip at a place if th...
Text Solution
|
- Show that the charges oscillate with a frequency given by omega = (1)...
Text Solution
|
- What is meant by diffraction of light? Write the conditions for maxima...
Text Solution
|
- Explain the experimental setup used to study photoelectric effect with...
Text Solution
|
- What are logic gates? Give the logic symbol of NOT and AND gates.
Text Solution
|