A
B
C
D
Text Solution
Verified by Experts
The correct Answer is:


Topper's Solved these Questions
KINEMATICS
MTG-WBJEE|Exercise WB JEE Previous Years Questions (CATEGORY 1 : Single Option Correct Type (1 Mark) )|9 VideosKINEMATICS
MTG-WBJEE|Exercise WB JEE Previous Years Questions (CATEGORY 3 : One or More than One Option Correct Type (2 Marks) )|1 VideosKINEMATICS
MTG-WBJEE|Exercise WB JEE WORKOUT ( CATEGORY 2 : Single Option Correct Type (2 Marks))|15 VideosHEAT AND THERMAL PHYSICS
MTG-WBJEE|Exercise WB JEE PREVIOUS YEARS QUESTIONS|15 VideosKINETIC THEORY OF GASES
MTG-WBJEE|Exercise WB JEE PREVIOUS YEARS QUESTIONS (MCQ)|7 Videos
Similar Questions
Explore conceptually related problems
MTG-WBJEE-KINEMATICS -WB JEE WORKOUT ( CATEGORY 3 : One or More than One Option Correct Type (2 Marks))
- Given two vectors vec(A)=3hat(i)+4hat(j) and vec(B)=hat(i)+hat(j).thet...
Text Solution
|
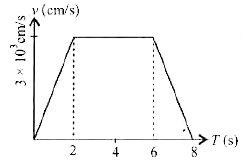
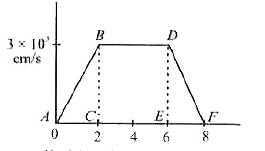
- The velocity time graph of the motion of a car is given here.
Text Solution
|
- Acceleration-time graph of a body is shown. The corresponding velocity...
Text Solution
|
- The resultant of three vectors 1,2, and 3 units whose directions are t...
Text Solution
|
- The relation between time and displacement x is t =alphax^(2) + betax,...
Text Solution
|
- The velocity-time plot for a particle moving on a straight line is sho...
Text Solution
|
- If vecA = 2 hati + hatj + hatk and vecB = hati + hatj + hatk are two ...
Text Solution
|
- A bullet on penetrating 30 cm into its target loses its velocity by 50...
Text Solution
|
- The resultant of vectors vecP and vecQ is vecR. The resultant becomes ...
Text Solution
|
- A particle of mass m moves on the x-axis as follows: It starts from re...
Text Solution
|