Text Solution
Verified by Experts


Similar Questions
Explore conceptually related problems
Recommended Questions
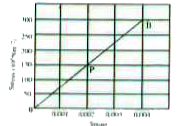
- Figure show the stress-strain curve for a given material. What are (a)...
Text Solution
|
- Figure shows the strain stress curve for a given material. The Young's...
Text Solution
|
- Fig., shows the stress-strain curve for a given materal. What are (a) ...
Text Solution
|
- Figure 9.11 shown the strain - stress curve for a given material. What...
Text Solution
|
- Figure 9.11 shown the strain - stress curve for a given material. What...
Text Solution
|
- Fig., shows the stress-strain curve for a given materal. What are (a) ...
Text Solution
|
- Figure shows the strain-stress curve for a given material. What are (a...
Text Solution
|
- The stress-strain graphs for materials A and B The graphs are drawn to...
Text Solution
|
- Figure show the stress-strain curve for a given material. What are (a)...
Text Solution
|