A
B
C
D
Text Solution
Verified by Experts
The correct Answer is:


Similar Questions
Explore conceptually related problems
Recommended Questions
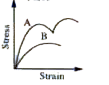
- The diagram shows stress v/s strain curve for the materials A and B. F...
Text Solution
|
- The diagram shoes stress v/s strain curve for the materials A and B. F...
Text Solution
|
- Figure shows the strain stress curve for a given material. The Young's...
Text Solution
|
- Fig., shows the stress-strain curve for a given materal. What are (a) ...
Text Solution
|
- The diagram shows stress v/s strain curve for the materials A and B. F...
Text Solution
|
- Fig., shows the stress-strain curve for a given materal. What are (a) ...
Text Solution
|
- चित्र में दो पदार्थो के प्रतिबल-विकृति वक्र दर्शाए गए हैं, (समान स्केल...
Text Solution
|
- Stress And Strain|Hookes Law#!#Stress Strain Curve
Text Solution
|
- Figure shows the strain-stress curve for a given material. What are (a...
Text Solution
|