Text Solution
Verified by Experts


Recommended Questions
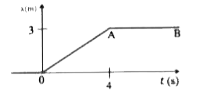
- Figure shows the position - time graph of a particle of mass 4 kg, the...
Text Solution
|
- Shown the position time graph of a particle of mass 4 kg What is the f...
Text Solution
|
- Fig. shows the position-time graph of a particle of mass 4 kg. What is...
Text Solution
|
- The motion of a particle of mass m is given by x=0 for t lt 0 s, x (t)...
Text Solution
|
- चित्र में 4 किग्रा संहति के किसी पिण्ड का स्थिति - समय ग्राफ दर्शाया ग...
Text Solution
|
- Fig. shows the position-time graph of a particle of mass 4 kg. What is...
Text Solution
|
- Figure shows the position-time graph of a particle of mass 4 kg. What ...
Text Solution
|
- Figure shows the position-time graph of a particle of mass 4 kg. What ...
Text Solution
|
- Figure shows the position-time graph of a particle of mass 4 kg. Wha...
Text Solution
|