


Similar Questions
Explore conceptually related problems
PSEB-COAL AND PETROLEUM-EXERCISE
- What are the advantages of using CNG and LPG as fuels?
Text Solution
|
- Name the petroleum product used for surfacing of roads.
Text Solution
|
- Describe how coal is formed from dead vegetation . What is this proce...
Text Solution
|
- Fill in the blanks. Fossil fuels are………………….. , ……………….. And …………………...
Text Solution
|
- Fill in the blanks. Process of seperation of different constituents f...
Text Solution
|
- Fill in the blanks. Least polluting fuel for vehicle is ……………………..
Text Solution
|
- Tick True/False against the following statements. Fossil fuels can b...
Text Solution
|
- Tick True/False against the following statements . CNG is more pollut...
Text Solution
|
- Tick True/False against the following statements. Coke is almost pure...
Text Solution
|
- Tick True/False against the following statements. Coal tar is a mixt...
Text Solution
|
- Tick True/False against the following statements. Kerosene is not a ...
Text Solution
|
- Explain why fossil fuels are exhaustible natural resources.
Text Solution
|
- Describe characterstics and uses of coke.
Text Solution
|
- Explain the process of formation of petroleum.
Text Solution
|
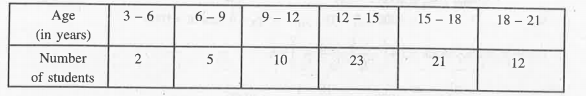
- The following table shows the ages of the students during a year are :...
Text Solution
|