


Topper's Solved these Questions
Similar Questions
Explore conceptually related problems
PSEB-MOTION-EXERCISE
- An athlete completes one round of a circular track of diameter 200m in...
Text Solution
|
- Joseph jogs from one end to the other end B of a straight 300m road i...
Text Solution
|
- Abdul while driving to school, computes the average speed for his trip...
Text Solution
|
- A motorboat starting from rest on a lake accelerates in a straight lin...
Text Solution
|
- A driver of a car travelling at 52kmh^(-1) applies the brake and acce...
Text Solution
|
- Fig 1.11 show the distance - time graphs of three A,B and C. Study th...
Text Solution
|
- Fig 1.11 show the distance - time graphs of three A,B and C. Study th...
Text Solution
|
- Fig 1.11 show the distance - time graphs of three A,B and C. Study th...
Text Solution
|
- Fig 1.11 show the distance - time graphs of three A,B and C. Study th...
Text Solution
|
- A ball is gently dropped from a height of 20 m. If its velocity increa...
Text Solution
|
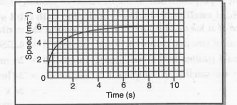
- The speed-time graph for a car is shown in Fig.8.12. Find how far does...
Text Solution
|
- Speed - time graph for a car is show in the fig 1.13:Which part of the...
Text Solution
|
- State which of the following situations are possible and give an examp...
Text Solution
|
- State which of the following situations are possible and give an examp...
Text Solution
|
- State which of the following situations are possible and give an examp...
Text Solution
|
- An artificial satellite is moving in a circular path orbit of radius 4...
Text Solution
|