A
B

C

D
Text Solution
Verified by Experts
The correct Answer is:


Topper's Solved these Questions
KINEMATICS
AAKASH SERIES|Exercise LECTURE SHEET (EXERCISE-III) ( Graphs) ( More than One Correct answer Type Questions)|1 VideosKINEMATICS
AAKASH SERIES|Exercise LECTURE SHEET (EXERCISE-III) ( Graphs) (Linked Comprehension Type Questions)|3 VideosKINEMATICS
AAKASH SERIES|Exercise LECTURE SHEET (EXERCISE - II) (Vertical Motion)( Integer Type Questions)|1 VideosHORIZONTAL CIRCULAR MOTION
AAKASH SERIES|Exercise ADDITIONAL PRACTICE EXERCISE (PRACTICE SHEET (ADVANCED) Integer Type Questions)|3 VideosKINETIC THEORY OF GASES
AAKASH SERIES|Exercise Practice Exercise|15 Videos
Similar Questions
Explore conceptually related problems
AAKASH SERIES-KINEMATICS-LECTURE SHEET (EXERCISE-III) ( Graphs) (Straight Objective Type Questions)
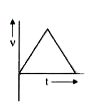
- For the velocity time graph shown in figure below the distance covered...
Text Solution
|
- In the given v-t graph. The distance travelled by the body in 5 second...
Text Solution
|
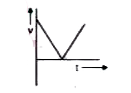
- A particle moves in a straight line obeying the v-t graph as shown in ...
Text Solution
|
- A particle starts from rest. Its acceleration (a) versus time (t) is a...
Text Solution
|
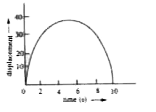
- The displacement-time graph of a moving object is shown in figure. Whi...
Text Solution
|
- In the x-t plot of a particle in one dimensional motion. Four differen...
Text Solution
|
- In above problem identify incorrect sign of average velocity for an in...
Text Solution
|
- A particle is moving in x-y plane with y = x/2 and v(x) = 4-2t. The ...
Text Solution
|
- The acceleration of a particle varie with time as shown in the figur...
Text Solution
|
- The acceleration displacement graph of a particle moving in a straight...
Text Solution
|
- The acceleration - time graph of a particle moving along a straight li...
Text Solution
|