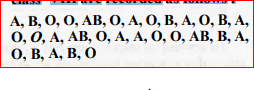
 Represent this data in the form of a frequency distribution table. Which is themost common and which is the rarest blood group among these students ?


Similar Questions
Explore conceptually related problems
Recommended Questions
- The blood groups of 30 students of a class VIII are recorded as follow...
Text Solution
|
- In which of the above given blood vessels maximum urea is present.
Text Solution
|
- Which of the following are correct chain isomers of butane ? (i) <img ...
Text Solution
|
- Determine the point of symmetry of a regular hexagon. <img src="htt...
Text Solution
|
- Dtermine the images of the following figure about the given line : ...
Text Solution
|
- Match the following Column A to Column B
Text Solution
|
- Match the following Column A to Column B
Text Solution
|
- Match the following Column A to Column B
Text Solution
|
- The inequation represented by the graph given below is : <img src="htt...
Text Solution
|