Home
Class 11
MATHS
Thirty children were asked about the num...

Thirty children were asked about the number of hours they watched TV programmes in the previous week. The results were found as follows :
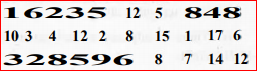
: Make a frequency distribution table for this data, taking class width 5 and one of the class interval as 5— 10

Promotional Banner

Similar Questions

Explore conceptually related problems

Thirty children were asked about the number of hours they watched TV programmes in the previous week. The results were found as follows : : How many children watched television for 15 or more hours a week ?

A company manufactures carbatteries of particular type. The lives (in years) of 40 such batteries were recorded as follows : Construct a grouped frequency distribution table for this data, using class intervals of size 0.5 starting from the interval 2— 2.5.

A study was conducted to find out the concentration of sulphur dioxide in the air in parts per million (ppm) of a certain city. The data obtained for 30 days is as follows : Make a grouped frequency distribution table for this data with class intervals as 0.00 - 0.04, 0.04 -0.08 and so on.

Distance (in km) of 40 engineers from their place of residence to their place of work were found as follows Construct n grouped frequency distribution table with class size 5 for the data given above taking the first interval as 0— 5 (5 not included). What main features do you observe from this tabular representation ?

Distance of 40 engineers from their place of residence to their place of work were found as follows construct a grouped frequency distribution table with class size 5 for the data given above taking the first interval as 0-5. what main featues do you observe from his tabular representation.

The height of 50 students, measured to the nearest centimetres have been found to be as follows: Represent the data given above by a grouped frequency distribution table, taking the class intervals as 160-165, 165-170 etc.

In a primary school, the parents were asked about the number of hours they spent per day in helping their. Children to do homw work. There were 90 parents who helped for (1)/(2) hour to 1(1)/(2) hours. The distribution of parents according to the time for which, they said they helped is given in the figure below : 20% helped for more than 1 ""1//2 hours per day, 30% helped for (1)/(2)" hour to "1 (1)/(2) hours, 50% did not help at all. Using this, answer the following: How many parents were surveyed?

In a primary school, the parents were asked about the number of hours they spent per day in helping their. Children to do home work. There were 90 parents who helped for (1)/(2) hour to 1(1)/(2) hours. The distribution of parents according to the time for which, they said they helped is given in the figure below : 20% helped for more than 1 ""1//2 hours per day, 30% helped for (1)/(2)" hour to "1 (1)/(2) hours, 50% did not help at all. Using this, answer the following: How many said that they helped for more than 1 (1)/(2) hours?

In a primary school, the parents were asked about the number of hours they spent per day in helping their. Children to do homw work. There were 90 parents who helped for (1)/(2) hour to 1(1)/(2) hours. The distribution of parents according to the time for which, they said they helped is given in the figure below : 20% helped for more than 1 ""1//2 hours per day, 30% helped for (1)/(2)" hour to "1 (1)/(2) hours, 50% did not help at all. Using this, answer the following: How many said that they did not help?