 : Is there any other suitable graphical representation for the same data ?


Similar Questions
Explore conceptually related problems
Recommended Questions
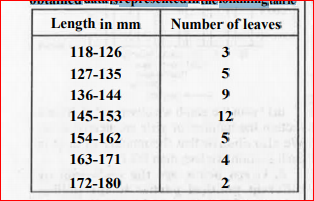
- The length of 40 leaves of a plant are measured correct to one millime...
Text Solution
|
- The length of 40 leaves of a plant are measured correct to one millime...
Text Solution
|
- The length of 40 leaves of a plant measured correct to one millimetre ...
Text Solution
|
- Which of the following are correct chain isomers of butane ? (i) <img ...
Text Solution
|
- Determine the point of symmetry of a regular hexagon. <img src="htt...
Text Solution
|
- Match the following Column A to Column B
Text Solution
|
- Match the following Column A to Column B
Text Solution
|
- Match the following Column A to Column B
Text Solution
|
- The inequation represented by the graph given below is : <img src="htt...
Text Solution
|