Home
Class 11
MATHS
100 surnames were randomly picked up fro...

100 surnames were randomly picked up from a local telephone directory and a frequency distribution of the number of letters in the English alphabet in the surnames was found as follows :
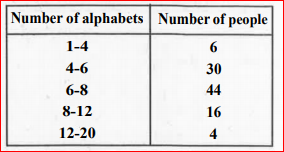
: Write the class interval in which the maximum number of surnames lie.

Promotional Banner

Similar Questions

Explore conceptually related problems

100 surnames were randomly picked up from a local telephone directory and a frequency distribution of the number of lettes in te english alphabet in the surnames was found as follows Write the class interval in which the minimum number of surnames lie.

100 surnames were randomly picked up from a local telephone directory and a frequency distribution of the number of letters in the English alphabet in the surnames was found as follows : : Draw a histogram to depict the given information.

100 surnames were randomly picked up from a local telephone directory and the frequency distribution of the number of lettersin the English alphabetsin the surnames was obtained as follows : Determines the median number of letters in the surnames. Find the mean number of letters in the surnames? Aso, find the modal size of the surnames.

From a telephone directory, 200 telephone numbers are chosen and frequency distribution of their right most digits (For example in the number 28563, the rightmost digit is 3) is given as follows : A next number is selected. What will be the probability that the rightmost digit in the number is 6.

Distance of 40 engineers from their place of residence to their place of work were found as follows construct a grouped frequency distribution table with class size 5 for the data given above taking the first interval as 0-5. what main featues do you observe from his tabular representation.

Distance (in km) of 40 engineers from their place of residence to their place of work were found as follows Construct n grouped frequency distribution table with class size 5 for the data given above taking the first interval as 0— 5 (5 not included). What main features do you observe from this tabular representation ?

Thirty children were asked about the number of hours they watched TV programmes in the previous week. The results were found as follows : : Make a frequency distribution table for this data, taking class width 5 and one of the class interval as 5— 10

Construct a grouped frequency table with class intervals 0-5, 5 -10 and so on for the following marks obtained in Biology (out of 50) by a group of 35 students in an examination : 0, 5, 6, 7, 10, 12, 14, 15, 20, 22, 25, 26, 27, 8, 11, 17, 3, 6, 9, 17, 19, 21, 22, 29, 31, 35,37, 40, 42, 45, 49, 4, 50, 16 and 20.: Which group contains the maximum number of students ?