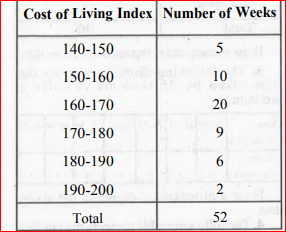
 Draw a histogram and frequency polygon for the above data on the same graph.


Similar Questions
Explore conceptually related problems
Recommended Questions
- In a city, the following weekly observations were made in a study on c...
Text Solution
|
- How many lines of symmetry does the above figure have ? <img src="http...
Text Solution
|
- Determine the point of symmetry of a regular hexagon. <img src="htt...
Text Solution
|
- Dtermine the images of the following figure about the given line : ...
Text Solution
|
- Draw the bisector of angleAOB=58^(@) ltimg src="https://d10lpgp6xz60...
Text Solution
|
- Match the following Column A to Column B
Text Solution
|
- Match the following Column A to Column B
Text Solution
|
- Match the following Column A to Column B
Text Solution
|
- The inequation represented by the graph given below is : <img src="htt...
Text Solution
|