Home
Class 11
MATHS
An Organisation selected 2400 families a...

An Organisation selected 2400 families at random and surveyed them to determine a relationship between income level and the number of vehiclesin a family. The information gathered is listed in the table below :
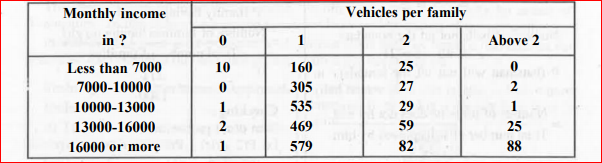
Suppose a family is chosen. Find the probability that the family chosen is : earning $ 16000 or more per month and owning exactly 1 vehicle.

Promotional Banner

Similar Questions

Explore conceptually related problems

An Organisation selected 2400 families at random and surveyed them to determine a relationship between income level and the number of vehiclesin a family. The information gathered is listed in the table below : Suppose a family is chosen. Find the probability that the family chosen is : earning $ 10000-13000 per month and owning exactly 2 vehicles.

An Organisation selected 2400 families at random and surveyed them to determine a relationship between income level and the number of vehiclesin a family. The information gathered is listed in the table below : Suppose a family is chosen. Find the probability that the family chosen is : earning $ 13000-16000 per month and owning more than 2 vehicles.

An Organisation selected 2400 families at random and surveyed them to determine a relationship between income level and the number of vehiclesin a family. The information gathered is listed in the table below : Suppose a family is chosen. Find the probability that the family chosen is : not more than 1 vehicle.

An Organisation selected 2400 families at random and surveyed them to determine a relationship between income level and the number of vehiclesin a family. The information gathered is listed in the table below : Suppose a family is chosen. Find the probability that the family chosen is : earning less than $ 7000 per month and does not own any vehicle.

An insurance company selected 2000 drivers at random (i.e., without any preference of one driver over another) in a particular city to find a relationship between age and accidents. The data obtained are given in the following table: Find the probabilities of the following events for a driver chosen at random from the city: being 18-29 years of age and having exactly 3 accidents in one year.

An insurance company selected 2000 drivers at random (i.e., without any preference of one driver over another) in a particular city to find a relationship between age and accidents. The data obtained are given in the following table: Find the probabilities of the following events for a driver chosen at random from the city: being 30-50 years of age and having one or more accidents in a year.

1500 families with 2 children were selected randomly, and the following data were recorded: Compute the probability of a family, chosen at random, having (i) 2 girls (ii) 1 girl (iii) No girl Also check whether the sum of these probabilities is 1.