 Find the probability that a student chosen at random : likes statistics.


Similar Questions
Explore conceptually related problems
Recommended Questions
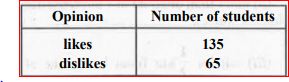
- To know the opinion of the students about the subject statistics, a su...
Text Solution
|
- To know the opinion of the students about the subject statistics, a su...
Text Solution
|
- Know the opinion of the students about Mathematics, a survey of 200...
Text Solution
|
- To know the opinion of people about the political leaders, a survey on...
Text Solution
|
- To know the opinion of the students about the subject Sanskrit , a sur...
Text Solution
|
- सांख्यिकी के बारे में विद्यार्थियों का मत जानने के लिए 200 विद्य...
Text Solution
|
- सांख्यिकी विषय के बारे में विद्यार्थियों के विचार जानने के लिए 200 विद...
Text Solution
|
- To know the opinion of the students about the subject statistics , a s...
Text Solution
|
- To know the opinion of the students about the subject statistics , a s...
Text Solution
|