Home
Class 10
MATHS
The following table gives the enrollment...

The following table gives the enrollment in higher secondary school in 1978. Find the mean enrolment per H.S. School.

Promotional Banner

Topper's Solved these Questions

  • STATISTICS

    MBD|Exercise Exercise|54 Videos
  • Some Applications Of Trignometry

    MBD|Exercise 271|20 Videos
  • Surface Areas And Volumes

    MBD|Exercise Excercise|51 Videos

Similar Questions

Explore conceptually related problems

The following table gives the literacy rate (in percentage) of 35 cities. Find the mean literacy rate.

The following distribution gives the state-wise teacher-student ratio in higher secondary schools of India. Find the mode and mean of this data.Interpret, the two measures.

A survey was conducted by a groupofstudentsas a part of their enviromentawareness programme, in which they collected the following data regarding the number of plants in 20 houses in a locality. Find the mean number of plants per house. Which method did you use for finding the mean, and why?

The following table gives the distribution of the life time of 400 neon lamps : Find the median life time of a lamp.

The following table gives the number of students in IX class in a school during the academic years 2012-2013 to 2016-17 Represent the above data by a bar graph.

The following table gives the distribution of different families on education. Find mean expenditure on education of a family.

The following table shows the number of students in various classes in different school activities. Represent the above data by a pie chart.

The following table shows the weight of 50 persons find the mean, median, and mode.

The following table gives life time of 400 neon lamps: A bulb is selected at random. Find the probability of that the life time of the selected bulb is atleast 800 hours.

MBD-STATISTICS-Exercise
  1. Find the mean marks of the following cummulative frequency table :

    Text Solution

    |

  2. If the mean of the following data is 20.6. Find the missing frequency ...

    Text Solution

    |

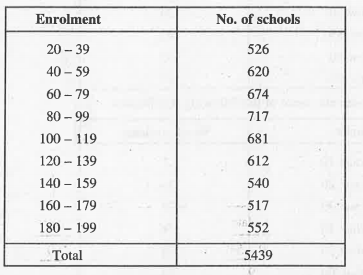
  3. The following table gives the enrollment in higher secondary school in...

    Text Solution

    |

  4. Find the mean of the following data using deviation method :

    Text Solution

    |

  5. Find the mean of the following data using deviation method :

    Text Solution

    |

  6. The table below gives the expenditure of distribution of female teache...

    Text Solution

    |

  7. Find the mean marks from the following data :

    Text Solution

    |

  8. Calculate the arithmetic mean of the following distribution.

    Text Solution

    |

  9. Calculate the mean of the following :

    Text Solution

    |

  10. Find the mean of the following distribution :

    Text Solution

    |

  11. Find the mean of the following data :

    Text Solution

    |

  12. Calculate the arithmetic mean of the following distribution

    Text Solution

    |

  13. Calculate the arithmetic mean for the following frequency distribution...

    Text Solution

    |

  14. A survey conducted on 20 households in a locality by a group of studen...

    Text Solution

    |

  15. The following table shows the ages of the students during a year are :...

    Text Solution

    |

  16. The following table givesthe information on the observed lifetimes(in ...

    Text Solution

    |

  17. Find the mode of the following distribution :

    Text Solution

    |

  18. Find the mode of the following distribution.

    Text Solution

    |

  19. Find the mode of the following distribution :

    Text Solution

    |

  20. Find the mode of the following distribution :

    Text Solution

    |