Home
Class 10
MATHS
The following distribution gives the sta...

The following distribution gives the state-wise teacher-student ratio in higher secondary schools of India. Find the mode and mean of this data.Interpret, the two measures.

Promotional Banner

Topper's Solved these Questions

  • STATISTICS

    MBD|Exercise Exercise|54 Videos
  • Some Applications Of Trignometry

    MBD|Exercise 271|20 Videos
  • Surface Areas And Volumes

    MBD|Exercise Excercise|51 Videos

Similar Questions

Explore conceptually related problems

The following table gives the enrollment in higher secondary school in 1978. Find the mean enrolment per H.S. School.

The following frequency distribution gives the monthly consumption of electricity of 68 consumers of a locality. Find the median, mean and mode of the data and compare them.

The following distribution gives the time taken by 25 students to solve a problem. Draw a histogram to represent the above Data.

The table below gives the expenditure of distribution of female teachers in the primary schools of rural areas of various states and U.T. of India. Find the mean percentage of female teachers by step deviation method.

The following data gives the distribution of total monthly household expenditure of 200 families of a village. Find the modal monthly expenditure of the families. Also, find the mean monthly expenditure :

The following table gives the distribution of different families on education. Find mean expenditure on education of a family.

The following table gives the distribution of students of two sections according to the marks obtained by them : : Represent the marks of the students of both the sections on the same graph by two frequency polygons. From the two polygons compare the performance of the twosections.

There are 102 teachers in a school of 3300 students.Find ratio of the number of teachers to the numbe of students.

MBD-STATISTICS-Exercise
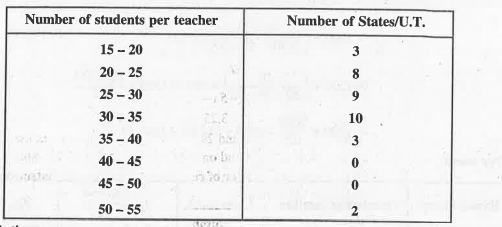
  1. The following distribution gives the state-wise teacher-student ratio ...

    Text Solution

    |

  2. In a city, the following weekly observations were made in a study of c...

    Text Solution

    |

  3. The following table gives the distribution of total household expendit...

    Text Solution

    |

  4. A frequency distribution of the life times of 400 T.V. Picture tubes t...

    Text Solution

    |

  5. Compute the missing frequencies f1 and f2 in the following data if the...

    Text Solution

    |

  6. The arithmatic mean of the following data is 14, find the value of P.

    Text Solution

    |

  7. The following table gives the distribution of different families on ed...

    Text Solution

    |

  8. Find the value of P, if the arithmatic mean of the following distribut...

    Text Solution

    |

  9. A candidate obtains the following percentage of marks in an examinatio...

    Text Solution

    |

  10. The mean of the following frequency table is 50, but the frequency f1a...

    Text Solution

    |

  11. If the mean of the following frequency distribution is 188. Find the m...

    Text Solution

    |

  12. Find the mean age of 100 residents of a colony from the following data...

    Text Solution

    |

  13. Find the mean marks by using assumed mean method secured by 140 studen...

    Text Solution

    |

  14. Find the mean marks of the following data :

    Text Solution

    |

  15. Using step deviation method, calculate the mean of the following data ...

    Text Solution

    |

  16. Find the mean marks of the following cummulative frequency table :

    Text Solution

    |

  17. If the mean of the following data is 20.6. Find the missing frequency ...

    Text Solution

    |

  18. The following table gives the enrollment in higher secondary school in...

    Text Solution

    |

  19. Find the mean of the following data using deviation method :

    Text Solution

    |

  20. Find the mean of the following data using deviation method :

    Text Solution

    |

  21. The table below gives the expenditure of distribution of female teache...

    Text Solution

    |