Home
Class 10
MATHS
The annual profits earned by 30 shops of...

The annual profits earned by 30 shops of a shopping complex in a locality gives rise to following distribution.

Draw both ogves for the data above. Hence obtain the median profit.

Promotional Banner

Topper's Solved these Questions

  • STATISTICS

    MBD|Exercise Exercise|54 Videos
  • Some Applications Of Trignometry

    MBD|Exercise 271|20 Videos
  • Surface Areas And Volumes

    MBD|Exercise Excercise|51 Videos

Similar Questions

Explore conceptually related problems

During the medial check up of 35 students of a class, their weights were recorded as follows: Draw a less than type ogive for the given data. Hence obtain the median weight from the graph and verify the result by using the formula.

The montly profits of 100 shops are distributed as follows Draw a histogram for the data and show the frequency polygon for it.

The following frequency distribution gives the monthly consumption of electricity of 68 consumers of a locality. Find the median, mean and mode of the data and compare them.

The following distribution gives the time taken by 25 students to solve a problem. Draw a histogram to represent the above Data.

After the ban on plastic bags, students of one school decided to make the people aware of the harmful effects of plastic bags on environment and Yamuna River. To make the awareness more impactful, they organized rally by joining hands with other schools and distributed paper bags to vegetable vendors, shop keepers and departmental stores. All students pledged not to use polythene bags in future to save Yamuna River. After reading the above passage, answer the following question : What are biodegradable polymers? Give one example?

The following table gives the distribution of IQ (intelligence Quotient) of 60 pupils of class IX in a school Draw a histrogram to represent the above data.

MBD-STATISTICS-Exercise
  1. Find the mode of the following data:

    Text Solution

    |

  2. Find the mode of the following frquency distribution :

    Text Solution

    |

  3. Find the mode of the following distribution :

    Text Solution

    |

  4. Find the mode of the following distribution :

    Text Solution

    |

  5. A survey regarding the heigths (in cm) of 51 girls of Class X of a sch...

    Text Solution

    |

  6. The median of the following data is 525. Find the values of x and y, i...

    Text Solution

    |

  7. From the data of weight of 122 persons determine median .

    Text Solution

    |

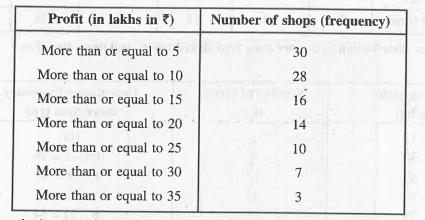
  8. The annual profits earned by 30 shops of a shopping complex in a local...

    Text Solution

    |

  9. On the basis of the following frequency distribution draw less than cu...

    Text Solution

    |

  10. Height of 50 plants in a garden were recorded and data is presented as...

    Text Solution

    |

  11. The following table shows the distribution of salaries of a group of w...

    Text Solution

    |

  12. Determine median-value of the following series using graphic method : ...

    Text Solution

    |

  13. Draw ‘less than ogive’ for the following data and determine median :

    Text Solution

    |

  14. Make a ‘more than’ cumulative frequency on the bases of no. of workers...

    Text Solution

    |

  15. Draw less than ogive curve.

    Text Solution

    |

  16. Draw an ogive curve from the following data and find out : Median wage

    Text Solution

    |

  17. Draw ‘less than’ cumulative frequency curve on the basis of following ...

    Text Solution

    |

  18. Draw the cumulative frequency curve for the following given data :

    Text Solution

    |

  19. Draw the less than cumulative frequency graph for he following data :

    Text Solution

    |

  20. Draw the less than cummulative frequency graph for the following distr...

    Text Solution

    |