Home
Class 11
BIOLOGY
Analyse the graph showing the activity o...

Analyse the graph showing the activity of salivary amylase Why the activity declines below the optimum value?

Promotional Banner

Topper's Solved these Questions

  • ANIMAL KINGDOM

    MAXIMUM PUBLICATION|Exercise EXAMPLE|120 Videos
  • BODY FLUIDS AND CIRCULATION

    MAXIMUM PUBLICATION|Exercise EXSERCISE|138 Videos

Similar Questions

Explore conceptually related problems

Analyse the graph showing the activity of salivary amylase Which is the optimum temperature for salivary amylase obtained from the graph.

Analyze the graph showing the activity of an enzyme, influenced by temperature. What is meant by optimum temperature?

Analyze the graph showing the activity of an enzyme, influenced by temperature. Why does the enzyme activity decline at too high temperatures?

Prepare a graph showing the action of temperature on enzyme activity

Observe the graph showing the activity of an enzyme influenced by pH. Where is its site of action?

Observe the graph showing the activity of an enzyme influenced by pH. Name another similar enzyme acting on the same substrate.

Observe the graph showing the activity of an enzyme influenced by pH. Name the possible enzyme involved in this reaction.

Which graph shows zero activation energy?

Observe the graph showing the activity of an enzyme influenced by pH. Mention any other factor which affects this en zyme activity that results in a similar pattern of graph

MAXIMUM PUBLICATION-BIOMOLECULES-EXERCISE
  1. Prepare an equation for a chemical reaction using the following compon...

    Text Solution

    |

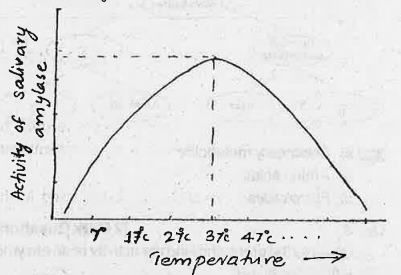
  2. Analyse the graph showing the activity of salivary amylase Which is th...

    Text Solution

    |

  3. Analyse the graph showing the activity of salivary amylase Why the act...

    Text Solution

    |

  4. Identify this compound.

    Text Solution

    |

  5. Name the bond produced when another biomolecule of the same category c...

    Text Solution

    |

  6. If a number of such molecules are bonded to- gether, what will be the ...

    Text Solution

    |

  7. Observe the following representation and fill up the blanks appropriat...

    Text Solution

    |

  8. Observe the graph showing the activity of an enzyme influenced by pH. ...

    Text Solution

    |

  9. Observe the graph showing the activity of an enzyme influenced by pH. ...

    Text Solution

    |

  10. Observe the graph showing the activity of an enzyme influenced by pH. ...

    Text Solution

    |

  11. Observe the graph showing the activity of an enzyme influenced by pH. ...

    Text Solution

    |

  12. Observe the graph ad answer the following: Find out the role of enzy...

    Text Solution

    |

  13. Observe the graph ad answer the following: Mention any two factors th...

    Text Solution

    |

  14. Name the chemical bonds formed between the following : Amino acids in ...

    Text Solution

    |

  15. Name the chemical bonds formed between the following : Sugar and phosp...

    Text Solution

    |

  16. Distinguish between cofactor and coenzyme with an example for each.

    Text Solution

    |

  17. Why are proteins heteropolymers?

    Text Solution

    |

  18. Identify the protein from the given list of biomacromolecules and writ...

    Text Solution

    |

  19. Identify the type of protein structures of 'A' and 'B'

    Text Solution

    |

  20. Symbolic representation of a functional enzyme is given below, Write o...

    Text Solution

    |