 Where is its site of action?


MAXIMUM PUBLICATION-BIOMOLECULES-EXERCISE
- Observe the following representation and fill up the blanks appropriat...
Text Solution
|
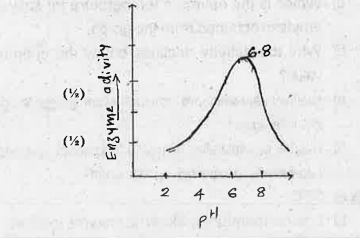
- Observe the graph showing the activity of an enzyme influenced by pH. ...
Text Solution
|
- Observe the graph showing the activity of an enzyme influenced by pH. ...
Text Solution
|
- Observe the graph showing the activity of an enzyme influenced by pH. ...
Text Solution
|
- Observe the graph showing the activity of an enzyme influenced by pH. ...
Text Solution
|
- Observe the graph ad answer the following: Find out the role of enzy...
Text Solution
|
- Observe the graph ad answer the following: Mention any two factors th...
Text Solution
|
- Name the chemical bonds formed between the following : Amino acids in ...
Text Solution
|
- Name the chemical bonds formed between the following : Sugar and phosp...
Text Solution
|
- Distinguish between cofactor and coenzyme with an example for each.
Text Solution
|
- Why are proteins heteropolymers?
Text Solution
|
- Identify the protein from the given list of biomacromolecules and writ...
Text Solution
|
- Identify the type of protein structures of 'A' and 'B'
Text Solution
|
- Symbolic representation of a functional enzyme is given below, Write o...
Text Solution
|
- Symbolic representation of a functional enzyme is given below, Name t...
Text Solution
|
- Symbolic representation of a functional enzyme is given below,What is ...
Text Solution
|
- Symbolic representation of a functional enzyme is given below, Name t...
Text Solution
|
- Symbolic representation of a functional enzyme is given below, Name t...
Text Solution
|
- Symbolic representation of a functional enzyme is given below,What is ...
Text Solution
|
- Identify the protein stuctures. (A) and (b) from the following figure.
Text Solution
|