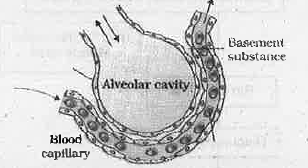
 Give the features visible in the diagram that help to increase the rate of diffusion across the wall of the alveoli into the blood.


MAXIMUM PUBLICATION-BREATHING AND EXCHANGE OF GASES-Exercise
- Pharynx is a common passage for air and food. Name the part for the pa...
Text Solution
|
- Pharynx is a common passage for air and food. How do these passage wor...
Text Solution
|
- Following figure shows a microscopic section through the alveoli in th...
Text Solution
|
- A person inhales to his maximum capacity and then he exhales also to h...
Text Solution
|
- A person inhales to his maximum capacity and then he exhales also to h...
Text Solution
|
- A person inhales to his maximum capacity and then he exhales also to h...
Text Solution
|
- Human beings have a significant ability to maintain and moderate the r...
Text Solution
|
- Observe the graph What is meant by 'Vmaxvalue?
Text Solution
|
- Observe the graph Why is 'V max not exceeded by any further rise in t...
Text Solution
|
- Observe the graph If a chemical substance closely resembling to that ...
Text Solution
|
- In a 400 metre race competition, Athira won the first place. Her frien...
Text Solution
|
- In a 400 metre race competition, Athira won the first place. Her frien...
Text Solution
|
- In a normal person expiratory reserve volume and residual volume were ...
Text Solution
|
- In a normal person expiratory reserve volume and residual volume were ...
Text Solution
|
- The graph given below is oxygen-haemoglobin dis sociation curve. Obser...
Text Solution
|
- The graph given below is oxygen-haemoglobin dis sociation curve. Obser...
Text Solution
|
- Identify the two true statements from the statements given below and r...
Text Solution
|
- Observe the figure and answer the questions. What is the partial pres...
Text Solution
|
- Observe the figure and answer the questions. Name the biological prin...
Text Solution
|
- Observe the figure and answer the questions. b) What happen when part...
Text Solution
|