Home
Class 11
BIOLOGY
Based on the graph given below, explain ...

Based on the graph given below, explain the effect of concentration of substrate on enzyme activity.

Promotional Banner

Topper's Solved these Questions

  • BODY FLUIDS AND CIRCULATION

    MAXIMUM PUBLICATION|Exercise EXSERCISE|138 Videos
  • Cell - The Unit of Life

    MAXIMUM PUBLICATION|Exercise EXERCISE|52 Videos

Similar Questions

Explore conceptually related problems

Prepare a graph showing the action of temperature on enzyme activity

Observe the diagram given below. . Explain double fertilization.

Observe the given graph a and b. Does the substrate concentration influence enzyme activity. If so, how?

Observe the figure given below and explain its structure. .

The following graph shows the relationship between subtrate concentration and rate of enzymatic reaction. What is the effect of subtrate concentration on rate of reaction ? And identify A.

The formation of SO_3 in the industrial pre-paration of sulphuric acid is given below. 2SO_2+O_2harr2SO_3+Heat : Explain the effect of concentration of O_2 to get maximum yield of SO_3 ? State rea son.

Some statements related to kinetic are given below. In certain cases, the rate is independent of the concentration of the reactants Illustrate and substantiate the above statements.

Convert the solution reared into four be: In the graph given below, when the react-ent and product attain the level A? What are the characteristics of the point A?

Analyze the graph showing the activity of an enzyme, influenced by temperature. Why does the enzyme activity decline at too high temperatures?

MAXIMUM PUBLICATION-BREATHING AND EXCHANGE OF GASES-Exercise
  1. Asthma and emphysema are two disorders of the human respiratory system...

    Text Solution

    |

  2. Correct the following misconceptions of a student regarding human resp...

    Text Solution

    |

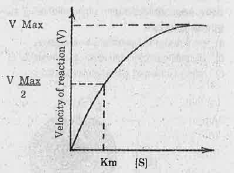
  3. Based on the graph given below, explain the effect of concentration of...

    Text Solution

    |

  4. Carefully observe the given Sigmoid curve on the graph and answer the ...

    Text Solution

    |

  5. Carefully observe the given Sigmoid curve on the graph and answer the ...

    Text Solution

    |

  6. Differentiate the process of inspiration and expiration.

    Text Solution

    |

  7. Define vital capacity. What is its significance?

    Text Solution

    |

  8. State the volume of air remaining in the lungs after a normal breathin...

    Text Solution

    |

  9. What are the major transport mechanisms for CO2 ? Explain

    Text Solution

    |

  10. What will be the pO2 and pCO2, in the atmospheric air compared to thos...

    Text Solution

    |

  11. What is the effect of pCO2, on oxygen transport?

    Text Solution

    |

  12. What happens to the respiratory process in a man going up a hill?

    Text Solution

    |

  13. Which one is the cofactor of carbonic anhydrase?

    Text Solution

    |

  14. Skin is an accessory organ or respiration in

    Text Solution

    |

  15. Which of the following respiratory organs are present in spiders and s...

    Text Solution

    |

  16. When the body is rapidly oxidising fats, excess ketone bodies accumula...

    Text Solution

    |

  17. Oxygen dissociation curve is

    Text Solution

    |

  18. Which one of the following statements is incorrect?

    Text Solution

    |

  19. Haemoglobin is having maximum affinity with

    Text Solution

    |

  20. Which is called Hamburger shift?

    Text Solution

    |