


Topper's Solved these Questions
Similar Questions
Explore conceptually related problems
ASHOK PUBLICATION ASSAM-Data Handling-EXAMPLE
- A Pictograph : Pictorial representation of data using symbols. I...
Text Solution
|
- A bar graph: A display of information using bars of uniform width, the...
Text Solution
|
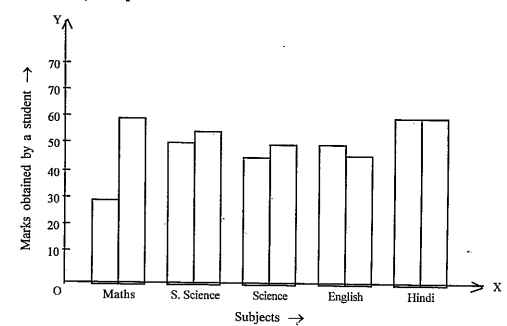
- Double Bar Graph : A bar graph showing two sets of data simultaneously...
Text Solution
|
- Double Bar Graph : A bar graph showing two sets of data simultaneously...
Text Solution
|
- Double Bar Graph : A bar graph showing two sets of data simultaneously...
Text Solution
|
- Double Bar Graph : A bar graph showing two sets of data simultaneously...
Text Solution
|
- Draw an appropriate graph to represent the given information.
Text Solution
|
- Draw a bar diagram of the following data.
Text Solution
|
- A group of students were asked to say which animal would like most to ...
Text Solution
|
- Study the following frequency distribution table and answer the questi...
Text Solution
|
- Study the following frequency distribution table and answer the questi...
Text Solution
|
- Study the following frequency distribution table and answer the questi...
Text Solution
|
- Study the following frequency distribution table and answer the questi...
Text Solution
|
- Study the following frequency distribution table and answer the questi...
Text Solution
|
- Construct a frequency distribution table for the data on weights (in k...
Text Solution
|
- Oberve the histogram and answer the questions given below. What i...
Text Solution
|
- Oberve the histogram and answer the questions given below. Which ...
Text Solution
|
- Oberve the histogram and answer the questions given below. How ma...
Text Solution
|
- Oberve the histogram and answer the questions given below. If we ...
Text Solution
|
- Each of the following pie charts gives you a different piece of inform...
Text Solution
|