


Topper's Solved these Questions
Similar Questions
Explore conceptually related problems
ASHOK PUBLICATION ASSAM-Data Handling-EXAMPLE
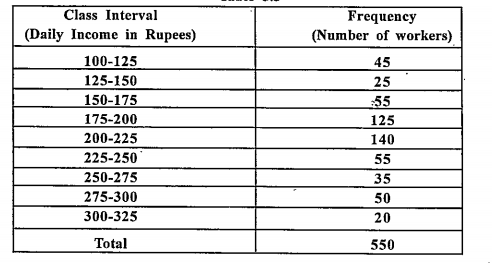
- Study the following frequency distribution table and answer the questi...
Text Solution
|
- Study the following frequency distribution table and answer the questi...
Text Solution
|
- Study the following frequency distribution table and answer the questi...
Text Solution
|
- Construct a frequency distribution table for the data on weights (in k...
Text Solution
|
- Oberve the histogram and answer the questions given below. What i...
Text Solution
|
- Oberve the histogram and answer the questions given below. Which ...
Text Solution
|
- Oberve the histogram and answer the questions given below. How ma...
Text Solution
|
- Oberve the histogram and answer the questions given below. If we ...
Text Solution
|
- Each of the following pie charts gives you a different piece of inform...
Text Solution
|
- Each of the following pie charts gives you a different piece of inform...
Text Solution
|
- Each of the following pie charts gives you a different piece of inform...
Text Solution
|
- Answer the following questions based on the pie chart given. Which t...
Text Solution
|
- Draw a pie chart of the data given below. The times spent by a child d...
Text Solution
|
- Which form of graph would be appropriate to display the following data...
Text Solution
|
- Which form of graph would be appropriate to display the following data...
Text Solution
|
- Try these If you try to start a scooter, the possible outcomes?
Text Solution
|
- Try these When a die is thrown, what are the six possible outcomes?
Text Solution
|
- Try these When you spin the wheel show, what are the possible outcom...
Text Solution
|
- You have a Basket with five identical balls of different colours and y...
Text Solution
|
- In throwing a die: Does the first player have a greater chance of ge...
Text Solution
|