


ASHOK PUBLICATION ASSAM-Visualising Solid Shapes-EXAMPLE
- Draw the front view, side view and to view of the given objects. A s...
Text Solution
|
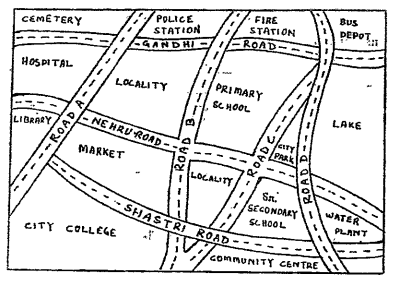
- Look at the given map of a city. Answer the following Mark a gr...
Text Solution
|
- Look at the given map of a city. Answer the following In red, d...
Text Solution
|
- Look at the given map of a city. Answer the following Which is ...
Text Solution
|
- Look at the given map of a city. Answer the following Which is ...
Text Solution
|
- Can a polyhedron have for its faces 3 triangles
Text Solution
|
- Can a polyhedron have for its faces 4 triangles
Text Solution
|
- Can a polyhedron have for its faces a square and four triangles.
Text Solution
|
- Is it possible to have a polyhedron with any given number of faces?
Text Solution
|
- Which are prisms among the following?
Text Solution
|
- Which are prisms among the following?
Text Solution
|
- Which are prisms among the following?
Text Solution
|
- Which are prisms among the following?
Text Solution
|
- How are prisms and cylinders alike?
Text Solution
|
- How are pyramids and cones alike?
Text Solution
|
- Is a square prism same as a cube? Explain.
Text Solution
|
- Verify Euler's formula for these solids.
Text Solution
|
- Verify Euler's formula for these solids.
Text Solution
|
- Using Euler's formula find the unknown.
Text Solution
|
- Can a polyhedron have 10 faces, 20 edges and 15 vertices?
Text Solution
|