Text Solution
Verified by Experts
The correct Answer is:


Topper's Solved these Questions
Similar Questions
Explore conceptually related problems
TARGET PUBLICATION-STATISTICS-Problem Set-6
- Different expenditures incurred on the construction of a building were...
Text Solution
|
- Cumulative frequencies in a grouped frequency table are useful to find...
Text Solution
|
- The median of the distances covered per litre shown in the above data ...
Text Solution
|
- The following table shows the income of formers in a grape season. Fin...
Text Solution
|
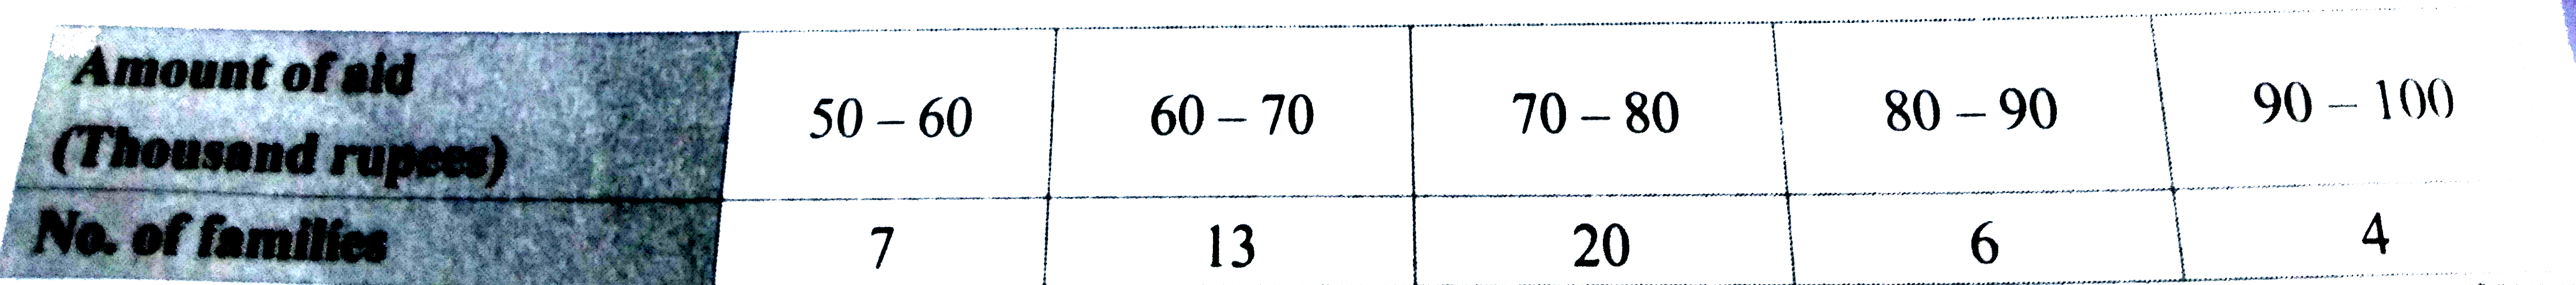
- The following frequency distribution table shows the amount of aid giv...
Text Solution
|