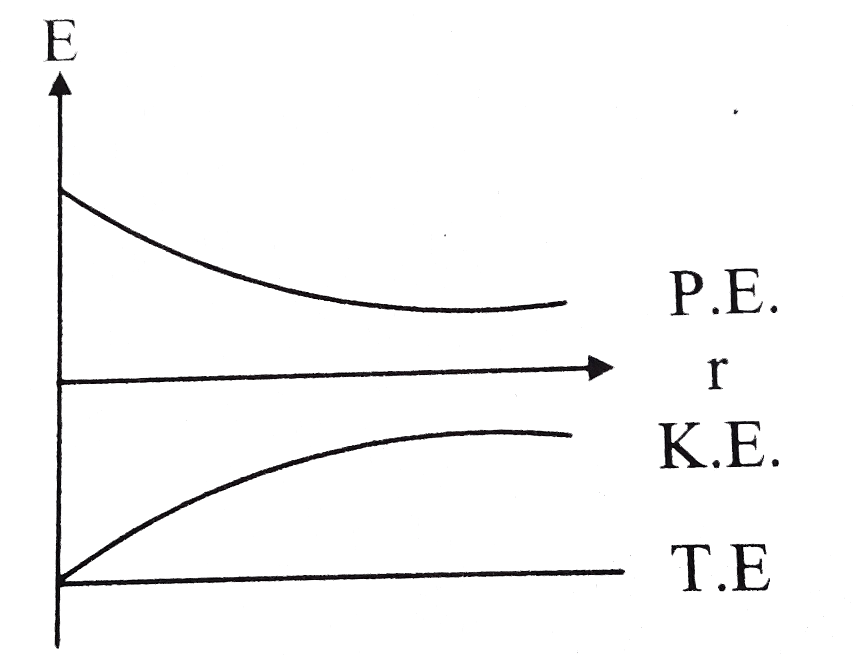
A
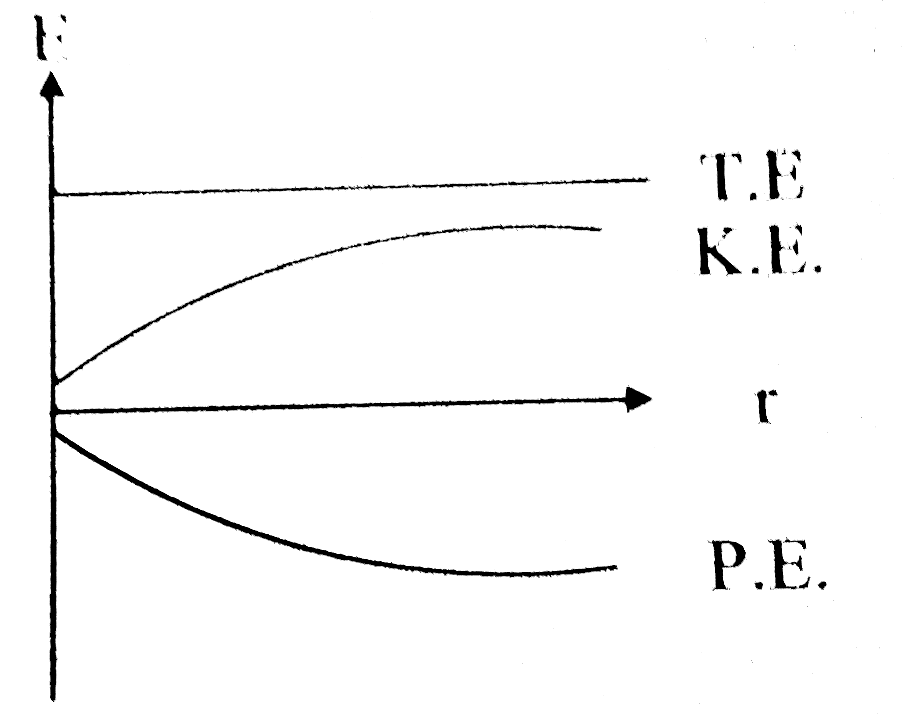
B
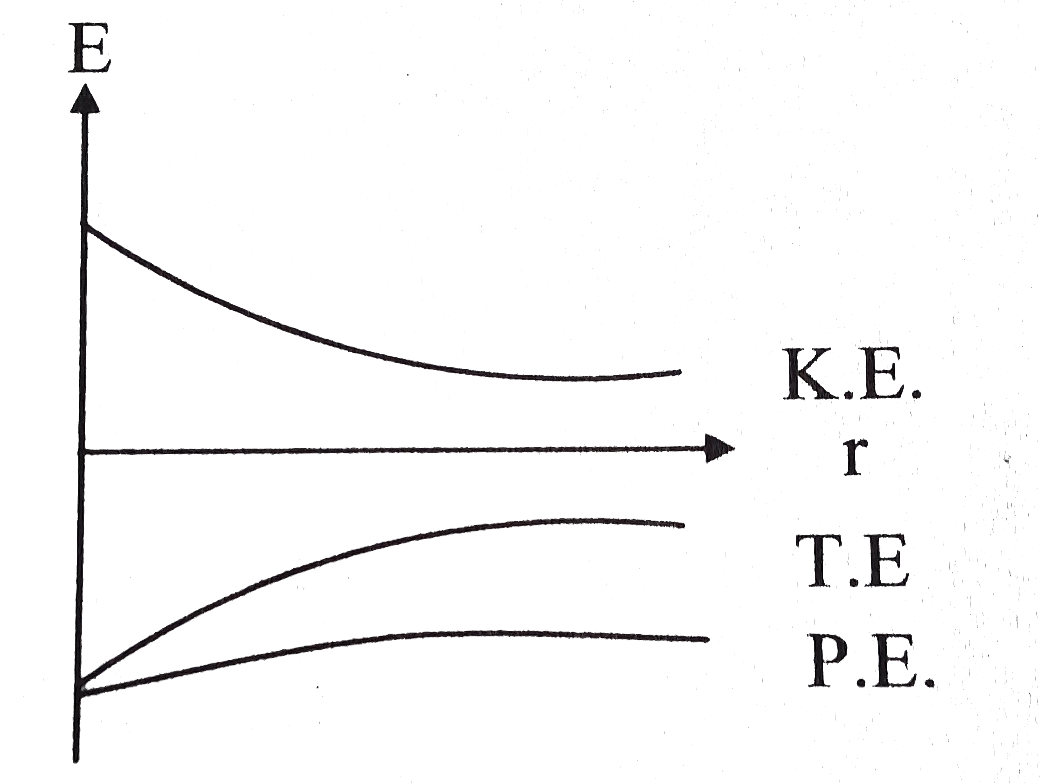
C
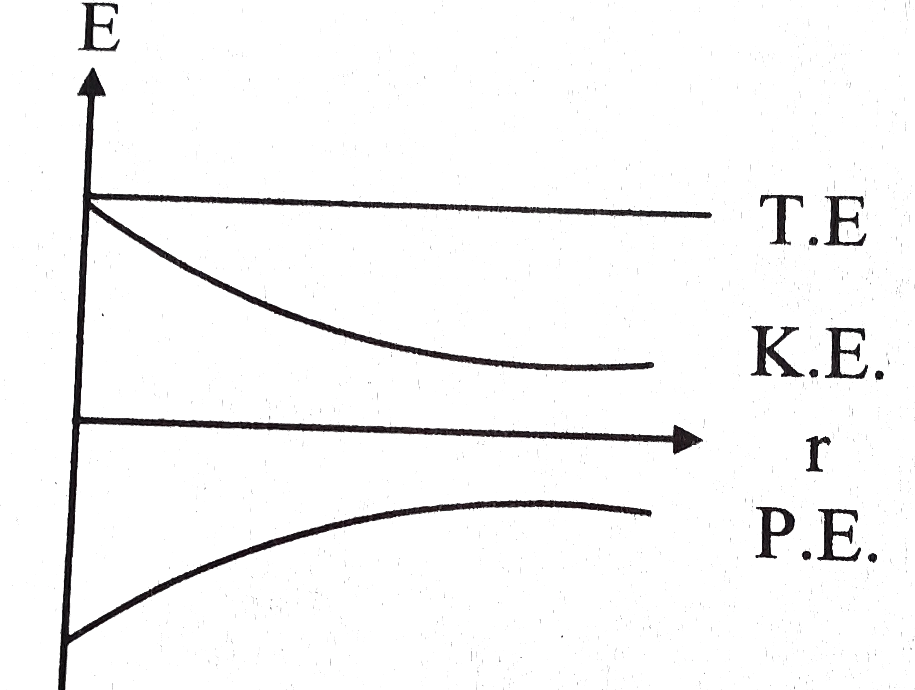
D
Text Solution
Verified by Experts
The correct Answer is:


Similar Questions
Explore conceptually related problems
Recommended Questions
- The correct graph representing the variation of total energy (E(t)), k...
Text Solution
|
- The correct graph representing the variation of total energy (E(t)) , ...
Text Solution
|
- The potential energy U(x) of a particle moving along x- axis is shown ...
Text Solution
|
- An artificial satellite moving in circular orbit around the earth has ...
Text Solution
|
- An artificial satellite moving in a circular orbit around the earth ha...
Text Solution
|
- An artificial satellite moving in a circular orbit around the Earth ha...
Text Solution
|
- An artificial satellite moving in a circular orbit around the Earth ha...
Text Solution
|
- The correct graph showing the change of total energy (E) kinetic energ...
Text Solution
|
- An artificial satellite moving in a circular orbit around the earth ha...
Text Solution
|