Text Solution
Verified by Experts
The correct Answer is:


Topper's Solved these Questions
Similar Questions
Explore conceptually related problems
TRUEMEN BIOLOGY ENGLISH-BIOMOLECULES -MULTIPLE CHOICE QUESTIONS
- Mutases and epimerases are
Text Solution
|
- The enzymatic function of a protein is due to
Text Solution
|
- Which one of the following diagrams represents the most common rela...
Text Solution
|
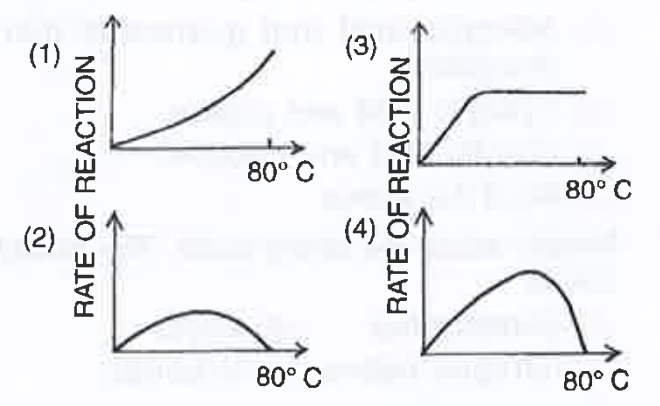
- The enzyme depicted in the below graph is
Text Solution
|
- Lipase acting of fats breaks
Text Solution
|
- Earliest known enzyme was
Text Solution
|
- No cell could live without
Text Solution
|
- The protein part of a conjugated enzyme is
Text Solution
|
- Enzyme that catalyse endergoinc synthesis coupled with exergonic h...
Text Solution
|
- Cofactors are
Text Solution
|
- The region that contains the binding and catalytic sites is termend...
Text Solution
|
- Enzyme/Proteins contian regulatory sites called
Text Solution
|
- Exnzyme concerned with the transfer of electrons is
Text Solution
|
- Substance which bring about changes in allosteric sites are called...
Text Solution
|
- The given graph is showing the relationship between the rate of ...
Text Solution
|
- In case of competitive inhibition of an enzyme,
Text Solution
|
- Which of the following remains unchanged in reversible competitiv...
Text Solution
|
- Which is common among Amylase, rennin and tryosin?
Text Solution
|
- Silph drugs/sulphanilamide kill bacteria by inhibting of which of th...
Text Solution
|
- One molecule of an enzyme is able to catalyse conversion of two molecu...
Text Solution
|