A
B
C
D
Text Solution
Verified by Experts
The correct Answer is:


Topper's Solved these Questions
MODEL TEST PAPER 1
MTG-WBJEE|Exercise CHEMISTRY (Category) 2 : Single Option correct type (2 mark) |5 VideosMODEL TEST PAPER 1
MTG-WBJEE|Exercise CHEMISTRY (Category) 3 : Single Option correct type (2 mark)|5 VideosIONIC EQUILIBRIA
MTG-WBJEE|Exercise WB JEE PREVIOUS YEARS QUESTIONS|10 VideosMODEL TEST PAPTER
MTG-WBJEE|Exercise MCQs|80 Videos
Similar Questions
Explore conceptually related problems
MTG-WBJEE-MODEL TEST PAPER 1 -CHEMISTRY (Category) 3 : Single Option correct type (2 mark)
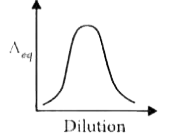
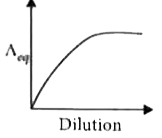
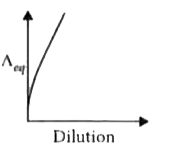
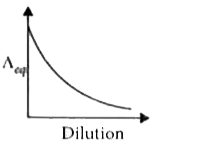
- Which of the following plots correctly represents variation of equival...
Text Solution
|
- Which statement is/are correct ?
Text Solution
|
- Mark the incorrect statement (s).
Text Solution
|
- Which of the following conditions is/are favourable for the feasibili...
Text Solution
|
- The hemiaceltel form of glucose is indicatred by
Text Solution
|
- Which of the following cations are present in the given salt mixture ?
Text Solution
|