A
B
C
D
Text Solution
Verified by Experts
The correct Answer is:


Topper's Solved these Questions
Similar Questions
Explore conceptually related problems
MCGROW HILL PUBLICATION-MOTION-HIGHER ORDER THINKING QUESTIONS
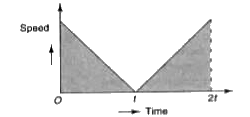
- In the following speed-time graph (Fig. 2.10), the shaded portion give...
Text Solution
|
- The location of a particle has changed. What can you say about the dis...
Text Solution
|
- A train 120m long is going towards north direction at a speed of 8ms^(...
Text Solution
|
- Which of the following velocity-time graphs does not represent motion ...
Text Solution
|
- A boy completes one round of a circular track of radius r in 40 s. His...
Text Solution
|
- A particle starts from the origin, goes along X-axis to the point (30m...
Text Solution
|
- A car runs on a circular track at a constant speed. The circular track...
Text Solution
|
- In question 68 above, the average velocity of the car is
Text Solution
|
- Which of the following distance-time graphs is not possible?
Text Solution
|
- Two persons start running towards each other from two points that arc ...
Text Solution
|
- In question 71 above, two persons meet each other from the first point...
Text Solution
|
- If a car at rest accelerates uniformly to a speed of 144km/h 20 s, it ...
Text Solution
|
- A body starting from rest is moving with a uniform acceleration of 8m/...
Text Solution
|
- A 120 m long train is moving in a direction with a speed of 20ms^(-1)....
Text Solution
|
- A bullet is fired with a speed of 10^(3)ms^(-1) in order to hit s targ...
Text Solution
|
- A car moves for half of its time at 80 km//h and for rest of time at 4...
Text Solution
|
- The distance (5) travelled varies with time (t) for four different-bod...
Text Solution
|
- The area under acceleration-time graph gives
Text Solution
|
- The displacement of a body is given to be proportional to the cube of ...
Text Solution
|
- Fig. 3.39 shows the acceleration - time graph for a particle in rectil...
Text Solution
|
- A body nis thrown vertically upward. Which of the following graphs cor...
Text Solution
|