


Topper's Solved these Questions
Similar Questions
Explore conceptually related problems
MAXIMUM PUBLICATION-STATISTICS-EXAMPLE
- Find the variance and standarddeviation of
Text Solution
|
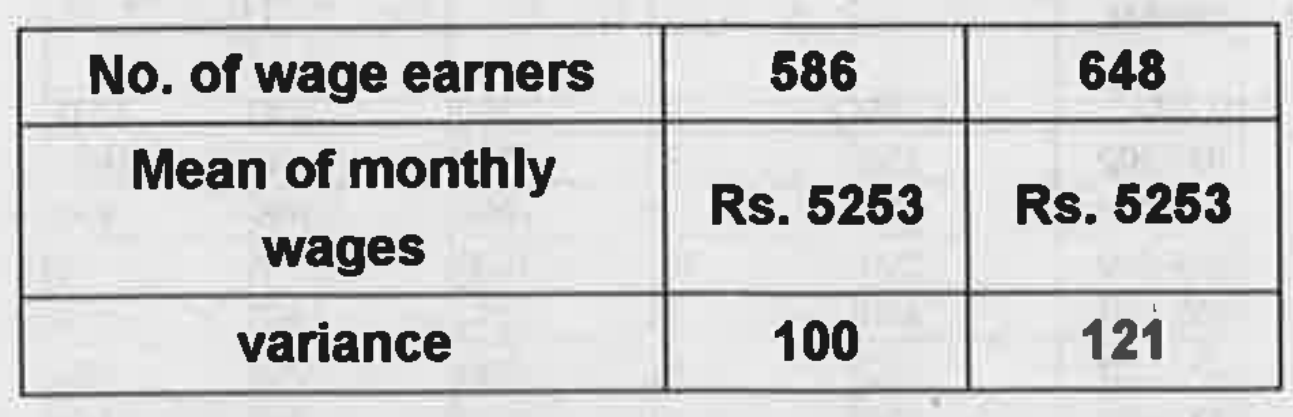
- An analysis of monthly wages paid to workers in two firms A and B ,bel...
Text Solution
|
- An analysis of monthly wages paid to workers in two firms A and B ,bel...
Text Solution
|
- The sum and squares corresponding to length x(in cm) and y(in gm) of 5...
Text Solution
|
- Find the variance and standard deviation of :
Text Solution
|
- Consider the numbers 4,7,8,9,10,12,13,17 Find the mean of the number...
Text Solution
|
- Consider the number 4,7,8,9,10,12,13,17 Find the mean deviation abou...
Text Solution
|
- Consider the numbers 4,7,8,9,10,12,13,17 Find the standard deviation...
Text Solution
|
- Consider the following data : 35,49,30,32,50,41,34,45,36 Find its ...
Text Solution
|
- Consider the folowing data : 35,49,30,32,50,41,34,45,37 Find its m...
Text Solution
|
- The mean and standard deviation of marks obtained by 50 students in a...
Text Solution
|
- a public Opinion polling agency surveyed 200 government employees . Th...
Text Solution
|
- a public Opinion polling agency surveyed 200 government employees . Th...
Text Solution
|
- Consider the following frequency table. Find the mean.
Text Solution
|
- Consider the following frequency table. Find the mean deviation abou...
Text Solution
|
- Consider the following data in respect of marks of 50 students in math...
Text Solution
|
- Consider the following data in respect of marks of 50 students in math...
Text Solution
|
- Consider the following data in respect of marks of 50 students in math...
Text Solution
|
- Find the standard deviation for the folowing data :
Text Solution
|
- Consider the frequency distribution Find the mean
Text Solution
|