


Topper's Solved these Questions
Similar Questions
Explore conceptually related problems
MAXIMUM PUBLICATION-STATISTICS-EXAMPLE
- Consider the folowing data : 35,49,30,32,50,41,34,45,37 Find its m...
Text Solution
|
- The mean and standard deviation of marks obtained by 50 students in a...
Text Solution
|
- a public Opinion polling agency surveyed 200 government employees . Th...
Text Solution
|
- a public Opinion polling agency surveyed 200 government employees . Th...
Text Solution
|
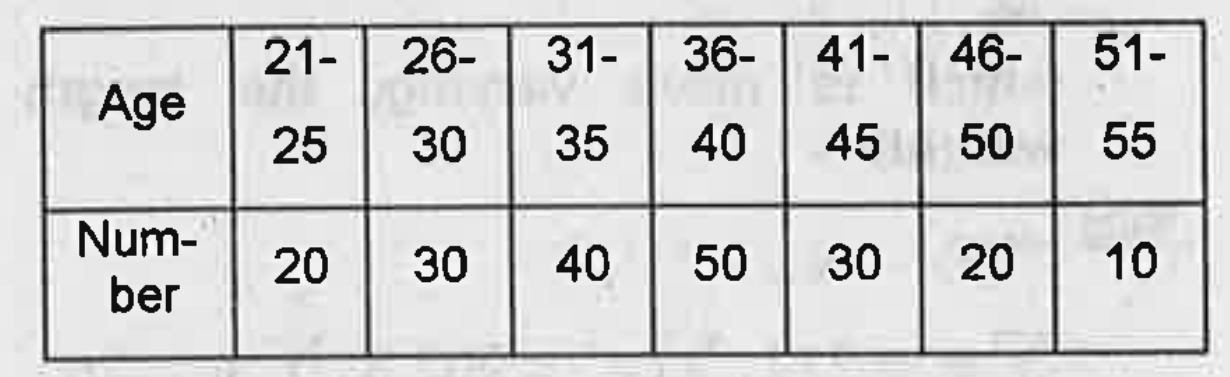
- Consider the following frequency table. Find the mean.
Text Solution
|
- Consider the following frequency table. Find the mean deviation abou...
Text Solution
|
- Consider the following data in respect of marks of 50 students in math...
Text Solution
|
- Consider the following data in respect of marks of 50 students in math...
Text Solution
|
- Consider the following data in respect of marks of 50 students in math...
Text Solution
|
- Find the standard deviation for the folowing data :
Text Solution
|
- Consider the frequency distribution Find the mean
Text Solution
|
- Consider the frequency distribution Calculate the variance and the s...
Text Solution
|
- Consider the frequency distribution Find the mean
Text Solution
|
- Consider the frequency distribution Calculate the variance and the s...
Text Solution
|
- Consider the following frequency table: find the mean
Text Solution
|
- Consider the following frequency table: find the mean deviation abou...
Text Solution
|
- Find the standard deviation for the data :
Text Solution
|
- The scores of two batsman A and B in 5 innings during a certain match ...
Text Solution
|
- The scores of two batsman A and B in 5 innings during a certain match ...
Text Solution
|
- The scores of two batsman A and B in 5 innings during a certain match ...
Text Solution
|