


Topper's Solved these Questions
Similar Questions
Explore conceptually related problems
MAXIMUM PUBLICATION-STATISTICS-EXAMPLE
- Consider the following frequency table. Find the mean deviation abou...
Text Solution
|
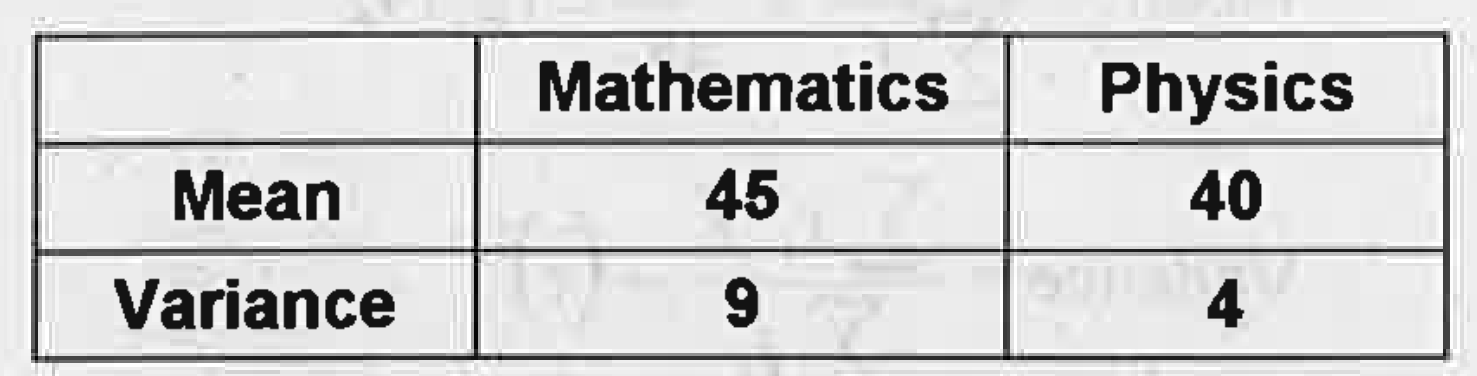
- Consider the following data in respect of marks of 50 students in math...
Text Solution
|
- Consider the following data in respect of marks of 50 students in math...
Text Solution
|
- Consider the following data in respect of marks of 50 students in math...
Text Solution
|
- Find the standard deviation for the folowing data :
Text Solution
|
- Consider the frequency distribution Find the mean
Text Solution
|
- Consider the frequency distribution Calculate the variance and the s...
Text Solution
|
- Consider the frequency distribution Find the mean
Text Solution
|
- Consider the frequency distribution Calculate the variance and the s...
Text Solution
|
- Consider the following frequency table: find the mean
Text Solution
|
- Consider the following frequency table: find the mean deviation abou...
Text Solution
|
- Find the standard deviation for the data :
Text Solution
|
- The scores of two batsman A and B in 5 innings during a certain match ...
Text Solution
|
- The scores of two batsman A and B in 5 innings during a certain match ...
Text Solution
|
- The scores of two batsman A and B in 5 innings during a certain match ...
Text Solution
|
- Calculate mean , variance and standard deviation for the following dis...
Text Solution
|
- Calculate the median and mean deviation about median for the following...
Text Solution
|
- Consider the following distribution: Calculate the mean of the distr...
Text Solution
|
- Consider the following distribution: Calculate the standard deviatio...
Text Solution
|
- Consider the following distribution: Find the mean
Text Solution
|