


PSEB-DATA HANDING -EXAMPLE
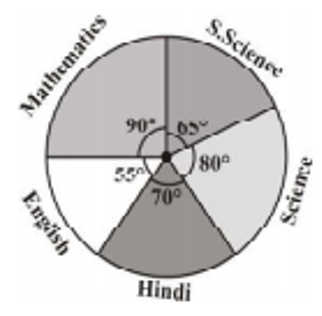
- The adjoining pie chart gives the marks scored in an examination by a ...
Text Solution
|
- Adjoining pie chart gives the expenditure (in percentage) on various i...
Text Solution
|
- Expenditure on which item is equal to the total savings of the family...
Text Solution
|
- If the monthly savings of the family is Rs.3,000.What is the monthly e...
Text Solution
|
- On a particular day,the sales (in rupees) of different items of a bake...
Text Solution
|
- A bag has 4 red balls and 2 yellow balls. (The balls are identical in ...
Text Solution
|