A
B
C
D
Text Solution
Verified by Experts
The correct Answer is:


Topper's Solved these Questions
ORGANISMS AND POPULATIONS
AAKASH SERIES|Exercise EXERCISE-I (LIFE HISTORY VARIATION)|3 VideosORGANISMS AND POPULATIONS
AAKASH SERIES|Exercise EXERCISE-I (POPULATION INTERACTIONS)|47 VideosORGANISMS AND POPULATIONS
AAKASH SERIES|Exercise EXERCISE-I (ADAPTATIONS)|13 VideosNEURAL CONTROL AND COORDINATION
AAKASH SERIES|Exercise EXERCISE-III( PREVIOUS AIPMT / NEET QUESTIONS)|34 VideosPHOTOSYNTHESIS IN HIGHER PLANTS
AAKASH SERIES|Exercise Exercise - III|27 Videos
Similar Questions
Explore conceptually related problems
AAKASH SERIES-ORGANISMS AND POPULATIONS-EXERCISE-I (POPULATIONS)
- In the equation N(t)=N(0)e^(tt),'e' is
Text Solution
|
- Which of the following is an incomplete count to estimate population d...
Text Solution
|
- A population has more young individuals compared to the older individu...
Text Solution
|
- Rather than the number of individuals, the per cent cover or biomass i...
Text Solution
|
- Percentage of individuals of a given age group in a given population i...
Text Solution
|
- Population density is the
Text Solution
|
- An age pyramid illustrates
Text Solution
|
- Read the following statements and select the correct option: (a) Age...
Text Solution
|
- Identify the status of the populations X, Y and Z whose age pyramids a...
Text Solution
|
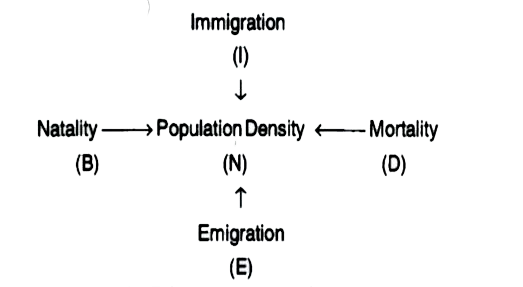
- Study the following flow chart and identify the attributes X and Y.
Text Solution
|
- Which of the following factors would not limit the growth of a populat...
Text Solution
|
- Study the following flow chart and choose the correct option.
Text Solution
|
- What does 'K' represent in the equation given below? (dN)/(dt)=rN((K...
Text Solution
|
- Which of the following statements is correct ?
Text Solution
|
- What does 'e' represent in the integral form of exponential growth equ...
Text Solution
|
- In a population, per capita birth rate is 0.05 and per capita death ra...
Text Solution
|
- Which of the following is not true about exponential growth in a popul...
Text Solution
|
- Which of the following equations correctly represents Verhulst-Pearl l...
Text Solution
|
- The integral form of exponential growth equation is
Text Solution
|
- Match the terms column-I with column-II and select the correct option
Text Solution
|