


Similar Questions
Explore conceptually related problems
JMD PUBLICATION-A Gift Paper from the publisher-Exercise
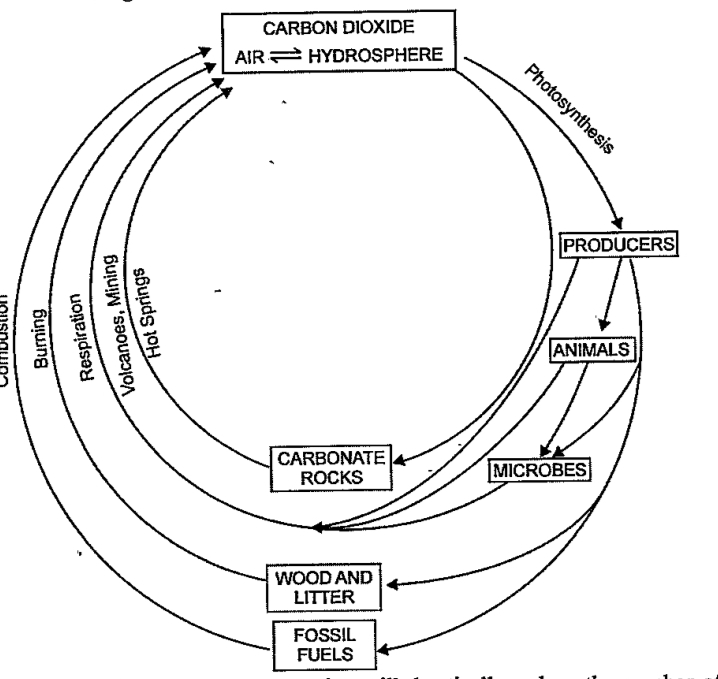
- Name the biochemical cycle shown in the below figure. How would the fl...
Text Solution
|
- 8-nucleate embryo sac in flowering plant is
Text Solution
|
- What happens during spermatogenesis
Text Solution
|
- What is function of copper-T
Text Solution
|
- ABO blood group is based on:
Text Solution
|
- Test cross of dihybrid ratio 1:1:1:1 .It proves that:
Text Solution
|
- If F1generation has all tall progenies and ratio of F2 generation is ...
Text Solution
|
- Which particular process was used by Meselson and Franklin in order to...
Text Solution
|
- DNA was first discovered by,
Text Solution
|
- Which of the following is purely inactive?
Text Solution
|
- DNA replication includes:
Text Solution
|
- Hodgkin's disease is:
Text Solution
|
- Most of the plant derived allergies in man are caused by:
Text Solution
|
- Bubonic plague is transmitted by:
Text Solution
|
- The segment of antigen that is specifically recognized by antibody is ...
Text Solution
|
- The ' clot buster' produced by Streptococcus and modified by genetic e...
Text Solution
|
- Which one is involved in biogas production?
Text Solution
|
- Fill in the blanks is produced by yeast Monascus.
Text Solution
|
- Fill in the blank is caused by Mycobacterium leprae.
Text Solution
|
- Fill in the blank Unpaired base pair of DNA end is called
Text Solution
|
- Fill in the blanks dissolves bacterial cell wall.
Text Solution
|