


Topper's Solved these Questions
Similar Questions
Explore conceptually related problems
JMD PUBLICATION-PRACTICE SAMPLE PAPER (SOLVED)-EXERCISE
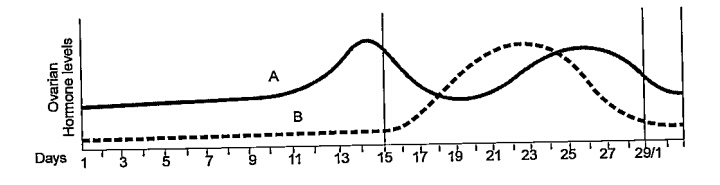
- The graph given below shows the variations in the levels of ovarian ho...
Text Solution
|
- The graph given below shows the variations in the levels of ovarian ho...
Text Solution
|
- The graph given below shows the variations in the levels of ovarian ho...
Text Solution
|
- The graph given below shows the variations in the levels of ovarian ho...
Text Solution
|
- The graph given below shows the variations in the levels of ovarian ho...
Text Solution
|
- In the adjacent population growth curve: What is the status of food ...
Text Solution
|
- In the adjacent population growth curve: In the absence of predators...
Text Solution
|
- In the adjacent population growth curve: Give the significance of do...
Text Solution
|
- The graph shows species area relationship. If b denotes the relatio...
Text Solution
|
- The graph shows species area relationship. If b denotes the relatio...
Text Solution
|
- The graph shows species area relationship. If b denotes the relatio...
Text Solution
|
- Species diversity of plants (22%) is much less than that of animals (7...
Text Solution
|
- A component of female reproductive system in angiosperms is
Text Solution
|
- How many ova and sperms would be produced from 100 secondary oocytes a...
Text Solution
|
- First human population explosion took place due to :
Text Solution
|
- The phenotypic ratio in the F2 generation of a dihybrid cross is :
Text Solution
|
- A woman is married for the second time. Her first husband was ABO bloo...
Text Solution
|
- Codominance is depicted by
Text Solution
|
- DNA multiplication is called :
Text Solution
|
- DNA length per turn of helix is :
Text Solution
|