


JMD PUBLICATION-PRACTICE SAMPLE PAPER (SOLVED)-EXERCISE
- In the adjacent population growth curve: Give the significance of do...
Text Solution
|
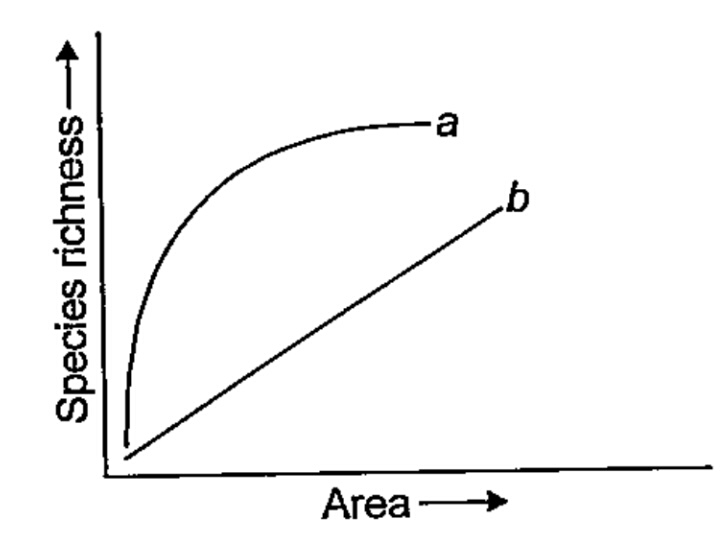
- The graph shows species area relationship. If b denotes the relatio...
Text Solution
|
- The graph shows species area relationship. If b denotes the relatio...
Text Solution
|
- The graph shows species area relationship. If b denotes the relatio...
Text Solution
|
- Species diversity of plants (22%) is much less than that of animals (7...
Text Solution
|
- A component of female reproductive system in angiosperms is
Text Solution
|
- How many ova and sperms would be produced from 100 secondary oocytes a...
Text Solution
|
- First human population explosion took place due to :
Text Solution
|
- The phenotypic ratio in the F2 generation of a dihybrid cross is :
Text Solution
|
- A woman is married for the second time. Her first husband was ABO bloo...
Text Solution
|
- Codominance is depicted by
Text Solution
|
- DNA multiplication is called :
Text Solution
|
- DNA length per turn of helix is :
Text Solution
|
- The following ratio is generally constant for a given species :
Text Solution
|
- RNA and DNA are similar in :
Text Solution
|
- Formation of antibodies within our body is called :
Text Solution
|
- Which one of the following diseases is due to an allergic reaction ?
Text Solution
|
- Which of the following displays immune tolerance ?
Text Solution
|
- Lysis of foreign cells is mediated through
Text Solution
|
- Acetic acid is produced by
Text Solution
|