Text Solution
Verified by Experts


Topper's Solved these Questions
MOTION
KUMAR PRAKASHAN|Exercise TEXTBOOK EXAMPLES/NUMERICALS |14 VideosMOTION
KUMAR PRAKASHAN|Exercise ADDITIONAL NUMERICALS FOR PRACTICE |48 VideosMOTION
KUMAR PRAKASHAN|Exercise MATCH THE FOLLOWING |10 VideosGRAVITATION
KUMAR PRAKASHAN|Exercise ACTIVITY 10.4|2 VideosQUESTION PAPER 01
KUMAR PRAKASHAN|Exercise SECTION - D|5 Videos
Similar Questions
Explore conceptually related problems
KUMAR PRAKASHAN-MOTION -ANSWER THE FOLLOWING
- A train travels at a speed of 60 km h^(-1) for 0.5 h, 24 km h^(-1) for...
Text Solution
|
- A ball is gently dropped from a height of 20 m. If its velocity increa...
Text Solution
|
- (a) A body thrown in the vertically upward direction rises up to a hei...
Text Solution
|
- An athlete completes one round of a circular track of diameter 200 m i...
Text Solution
|
- A driver of a car travelling at the speed of 52 km h^(-1) applies the...
Text Solution
|
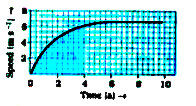
- The speed-time graph of a car is shown in figure given below Spee...
Text Solution
|
- Derive graphically s = ut + (1)/(2) at ^(2),where symbols have their ...
Text Solution
|
- write three equations of motion.
Text Solution
|
- A man travels a distance of 1.5 m towards East, then 2.0 m towards Sou...
Text Solution
|
- Joseph jogs from one end A to the other end B of a straight 300 m road...
Text Solution
|
- Abdul, while driving to school, computes the average speed for his tri...
Text Solution
|
- The distance-time graph of three objects A, B and C is shown below. St...
Text Solution
|
- A train travels at a speed of 60 km h^(-1) for 0.5 h, 24 km h^(-1) for...
Text Solution
|
- A ball is gently dropped from a height of 20 m. If its velocity increa...
Text Solution
|
- (a) A body thrown in the vertically upward direction rises up to a hei...
Text Solution
|
- An athlete completes one round of a ciruclar track of radius R in 40 s...
Text Solution
|
- A driver of a car travelling at the speed of 52 km h^(-1) applies the...
Text Solution
|
- The speed-time graph of a car is shown in figure given below Spee...
Text Solution
|
- Derive graphically s = ut + (1)/(2) at ^(2),where symbols have their ...
Text Solution
|
- Derive graphically v ^(2) = u ^(2) + 2as, where symbols have their u...
Text Solution
|