Home
Class 6
MATHS
The number of Mathematics books sold by ...

The number of Mathematics books sold by a shopkeeper on six consecutive days is shown below:
Draw a bar graph to represent the above Draw a Draw a bar graph to represent information choosing the scale of your choice.'

Promotional Banner

Topper's Solved these Questions

  • ALGEBRA

    SUBHASH PUBLICATION|Exercise Exercise |100 Videos
  • DECIMALS

    SUBHASH PUBLICATION|Exercise Exercise |136 Videos

Similar Questions

Explore conceptually related problems

Number of persons in various age groups in a town is given in the following table. Draw a bar Draw a bar graph to represent the above information and answer the following questins. (take 1 unit lenght = 20 thousands) (a) Which two age groups have same population?

Number of persons in various age groups in a town is given in the following table. Draw a bar Draw a bar graph to represent the above information and answer the following questins. (take 1 unit lenght = 20 thousands) (b) All persons in the age group of 60 and above are called senior citizens. How many senior citizens are there in the town?

Given below are the seats won by different political parties in the polling outcome of a state assembly elections: (i) Draw a bar graph to represent the polling results.

A random survey of the number of childern of various age groups playing in a park was found as follows : Draw a histogram to represent the data above.

Gopaiah sowed wheat and paddy in two fields of total area 5000 square meters. Write a linear equation and draw a graph to represent the same?

Read the bar graph given below which shows the number of books sold by a book store during five consecutive years and answer the following questions: Can you explain how you would estimate the number of books sold is 1989?

The following data on the number of girls of the nearesten per thousand boys in different sections of Indian society is given below. (i) Represent the information above by a bar graph.

Draw the graphs representing the variation of resistivity with temperature for (1) copper (2) nichrome (3) a typical semiconductor.

A survey of 120 school students was done to find which activity they prefer to do in their free time. Draw a bar graph to illustrate the above data taking scale of 1 unit length = 5 students. Which activity is preferred by most of the students other than playing?

SUBHASH PUBLICATION-DATA HANDLING-Exercise
  1. Total number of students of a school in different years is shown in th...

    Text Solution

    |

  2. Total number of students of a school in different years is shown in th...

    Text Solution

    |

  3. Total number of students of a school in different years is shown in th...

    Text Solution

    |

  4. The baar graph given alongside shows the amount of wheat purchased by...

    Text Solution

    |

  5. The baar graph given alongside shows the amount of wheat purchased by...

    Text Solution

    |

  6. Write the fraction representing the shaded portion.(iii)

    Text Solution

    |

  7. Observe this bar graph which is showing the sale of shirts in a ready ...

    Text Solution

    |

  8. Observe this bar graph which is showing the sale of shirts in a ready ...

    Text Solution

    |

  9. Observe this bar graph which is showing the sale of shirts in a ready ...

    Text Solution

    |

  10. Observe this bar graph which is showing the sale of shirts in a ready ...

    Text Solution

    |

  11. Observe this bar graph which shows the marks obtained by Aziz in half-...

    Text Solution

    |

  12. Observe this bar graph which shows the marks obtained by Aziz in half-...

    Text Solution

    |

  13. Observe this bar graph which shows the marks obtained by Aziz in half-...

    Text Solution

    |

  14. Observe this bar graph which shows the marks obtained by Aziz in half-...

    Text Solution

    |

  15. A survey of 120 school students was done to find which activity they p...

    Text Solution

    |

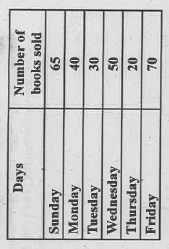
  16. The number of Mathematics books sold by a shopkeeper on six consecutiv...

    Text Solution

    |

  17. Follownig table shows the number of bicycles manufactured in a factory...

    Text Solution

    |

  18. Follownig table shows the number of bicycles manufactured in a factory...

    Text Solution

    |

  19. Number of persons in various age groups in a town is given in the foll...

    Text Solution

    |

  20. Number of persons in various age groups in a town is given in the foll...

    Text Solution

    |