Home
Class 6
MATHS
Follownig table shows the number of bicy...

Follownig table shows the number of bicycles manufactured in a factory during the years 1998 to2002. Illustrate this data using a bar graph. Choose a scale of your choice.
(b) In which In In which 
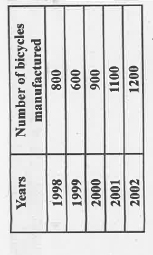
year were the miniimum number of bicycles manufactured?

Promotional Banner

Topper's Solved these Questions

  • ALGEBRA

    SUBHASH PUBLICATION|Exercise Exercise |100 Videos
  • DECIMALS

    SUBHASH PUBLICATION|Exercise Exercise |136 Videos

Similar Questions

Explore conceptually related problems

Follownig table shows the number of bicycles manufactured in a factory during the years 1998 to2002. Illustrate this data using a bar graph. Choose a scale of your choice. (a) In which In In which year were the maximum number of bicycles manufactured?

The baar graph given alongside shows the amount of wheat purchased by government during the year 1998-2002. read the bar graph andwrite down your observations. In which year was (a) the wheat production maximum?

The baar graph given alongside shows the amount of wheat purchased by government during the year 1998-2002. Read the bar graph and write down your observations. In which year was (b) the wheat production minimum?

Read the bar graph given below which shows the number of books sold by a book store during five consecutive years and answer the following questions: In which years were fewer than 250 books sold?

The following line graph shows the yearly sales figures for a manufacturing company. (a)What were the sales in (i)2002 (ii)2006? (b)What were the sales in(i)2003 (ii) 2005? (c)Compute the difference between the sales in 2002 and 2006. (d)In which year was there the greatest difference between the sales as compared to its previous year?

Read the bar graph given below which shows the number of books sold by a book store during five consecutive years and answer the following questions: Can you explain how you would estimate the number of books sold is 1989?

Read the bar graph given below which shows the number of books sold by a book store during five consecutive years and answer the following questions: In which year were about 225 books sold?

Observe this bar graph which is showing the sale of shirts in a ready made shop from Monday to Saturday. Now answer the following questions : (b) What is the scale chosen on the horizontal line representing number of shirts?

Total number of students of a school in different years is shown in the following table B Prepare another pictograph of students using any other symbol each representing 50 students. Which pictograph do you find more informative?

Read the bar graph given below which shows the number of books sold by a book store during five consecutive years and answer the following questions: About how many books were sold in 1989?1990?1992?

SUBHASH PUBLICATION-DATA HANDLING-Exercise
  1. Total number of students of a school in different years is shown in th...

    Text Solution

    |

  2. Total number of students of a school in different years is shown in th...

    Text Solution

    |

  3. Total number of students of a school in different years is shown in th...

    Text Solution

    |

  4. The baar graph given alongside shows the amount of wheat purchased by...

    Text Solution

    |

  5. The baar graph given alongside shows the amount of wheat purchased by...

    Text Solution

    |

  6. Write the fraction representing the shaded portion.(iii)

    Text Solution

    |

  7. Observe this bar graph which is showing the sale of shirts in a ready ...

    Text Solution

    |

  8. Observe this bar graph which is showing the sale of shirts in a ready ...

    Text Solution

    |

  9. Observe this bar graph which is showing the sale of shirts in a ready ...

    Text Solution

    |

  10. Observe this bar graph which is showing the sale of shirts in a ready ...

    Text Solution

    |

  11. Observe this bar graph which shows the marks obtained by Aziz in half-...

    Text Solution

    |

  12. Observe this bar graph which shows the marks obtained by Aziz in half-...

    Text Solution

    |

  13. Observe this bar graph which shows the marks obtained by Aziz in half-...

    Text Solution

    |

  14. Observe this bar graph which shows the marks obtained by Aziz in half-...

    Text Solution

    |

  15. A survey of 120 school students was done to find which activity they p...

    Text Solution

    |

  16. The number of Mathematics books sold by a shopkeeper on six consecutiv...

    Text Solution

    |

  17. Follownig table shows the number of bicycles manufactured in a factory...

    Text Solution

    |

  18. Follownig table shows the number of bicycles manufactured in a factory...

    Text Solution

    |

  19. Number of persons in various age groups in a town is given in the foll...

    Text Solution

    |

  20. Number of persons in various age groups in a town is given in the foll...

    Text Solution

    |