Text Solution
Verified by Experts


Similar Questions
Explore conceptually related problems
Recommended Questions
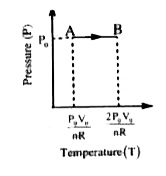
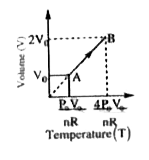
- Draw the P-T and V-T diagrams for an isobaric process of expansion, co...
Text Solution
|
- One mole of an ideal gas undergoes a process p=(p(0))/(1+((V)/(V(0...
Text Solution
|
- Draw the P-T and V-T diagrams of an isochoric process of n moles an id...
Text Solution
|
- Draw the P-T and V-T diagrams for an isobabaric process of expansion, ...
Text Solution
|
- An ideal monatomic gas is at P(0), V(0). It is taken to final volume 2...
Text Solution
|
- One mole of an ideal gas undergoes a process p=(p(0))/(1+((V(0))/(V))^...
Text Solution
|
- एक आदर्श गैस का एक मोल ऐसे प्रक्रम से गुजरता है, जिसमे दाब तथा आयतन सू...
Text Solution
|
- 2 moles of ideal monatomic gas is carried from a state (P(0) , V(0)) ...
Text Solution
|
- Draws the P-Tand V-T diagrams for an isobaric process of expansion, co...
Text Solution
|