


Topper's Solved these Questions
Similar Questions
Explore conceptually related problems
CHETANA PUBLICATION-STATISTICS-Exercise
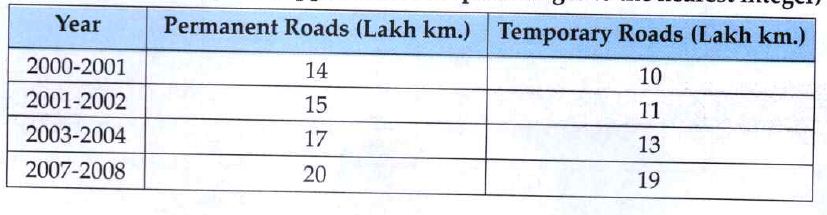
- In the table given below, the information is given about roads. Using ...
Text Solution
|
- Which of the following data is not primary?
Text Solution
|
- What is the upper class limit for the class 15-35?
Text Solution
|
- What is the class mark of class 25-35?
Text Solution
|
- If the classes are 0-10, 10-20,20-30… then in which class should the o...
Text Solution
|
- The mean of five numbers is 50, out of which mean of 4 numbers is 46, ...
Text Solution
|
- mean of 100 observations is 40. The 9 observation is 30. If this is re...
Text Solution
|
- What is the mode of 19, 19, 15, 20, 25, 15, 20, 15?
Text Solution
|
- What is the median of 7, 10, 7, 5, 9, 10?
Text Solution
|
- From following table, what is the cumulative frequency of less than ty...
Text Solution
|
- The mean of the data 87, 92, 63, 78, 92, 59, 72, 66, is……..
Text Solution
|
- The mark of a class test are given below 28, 26,17, 12, 14, 19, 27, 26...
Text Solution
|
- The mode of 18, 14, 22, 23, 14, 18, 17, 18, 28, 28, 14, 25, 14 is……………
Text Solution
|
- The mean of eleven number is 47. If a number is added then the mean is...
Text Solution
|
- A cricket player scored run in different matches as follows : 36, 41, ...
Text Solution
|
- Classify following information as primary data or secondary data. Numb...
Text Solution
|
- Classify following information as primary data or secondary data.Numbe...
Text Solution
|
- Classify following information as primary data or secondary data.Elect...
Text Solution
|
- Classify following information as primary data or secondary data.Elect...
Text Solution
|
- Classify following information as primary data or secondary data. Lete...
Text Solution
|
- All 30 members of a 'Nature Club' in a school planted trees in the fou...
Text Solution
|