Text Solution
Verified by Experts
The correct Answer is:


Topper's Solved these Questions
Similar Questions
Explore conceptually related problems
DC PANDEY ENGLISH-KINEMATICS-INTEGER_TYPE
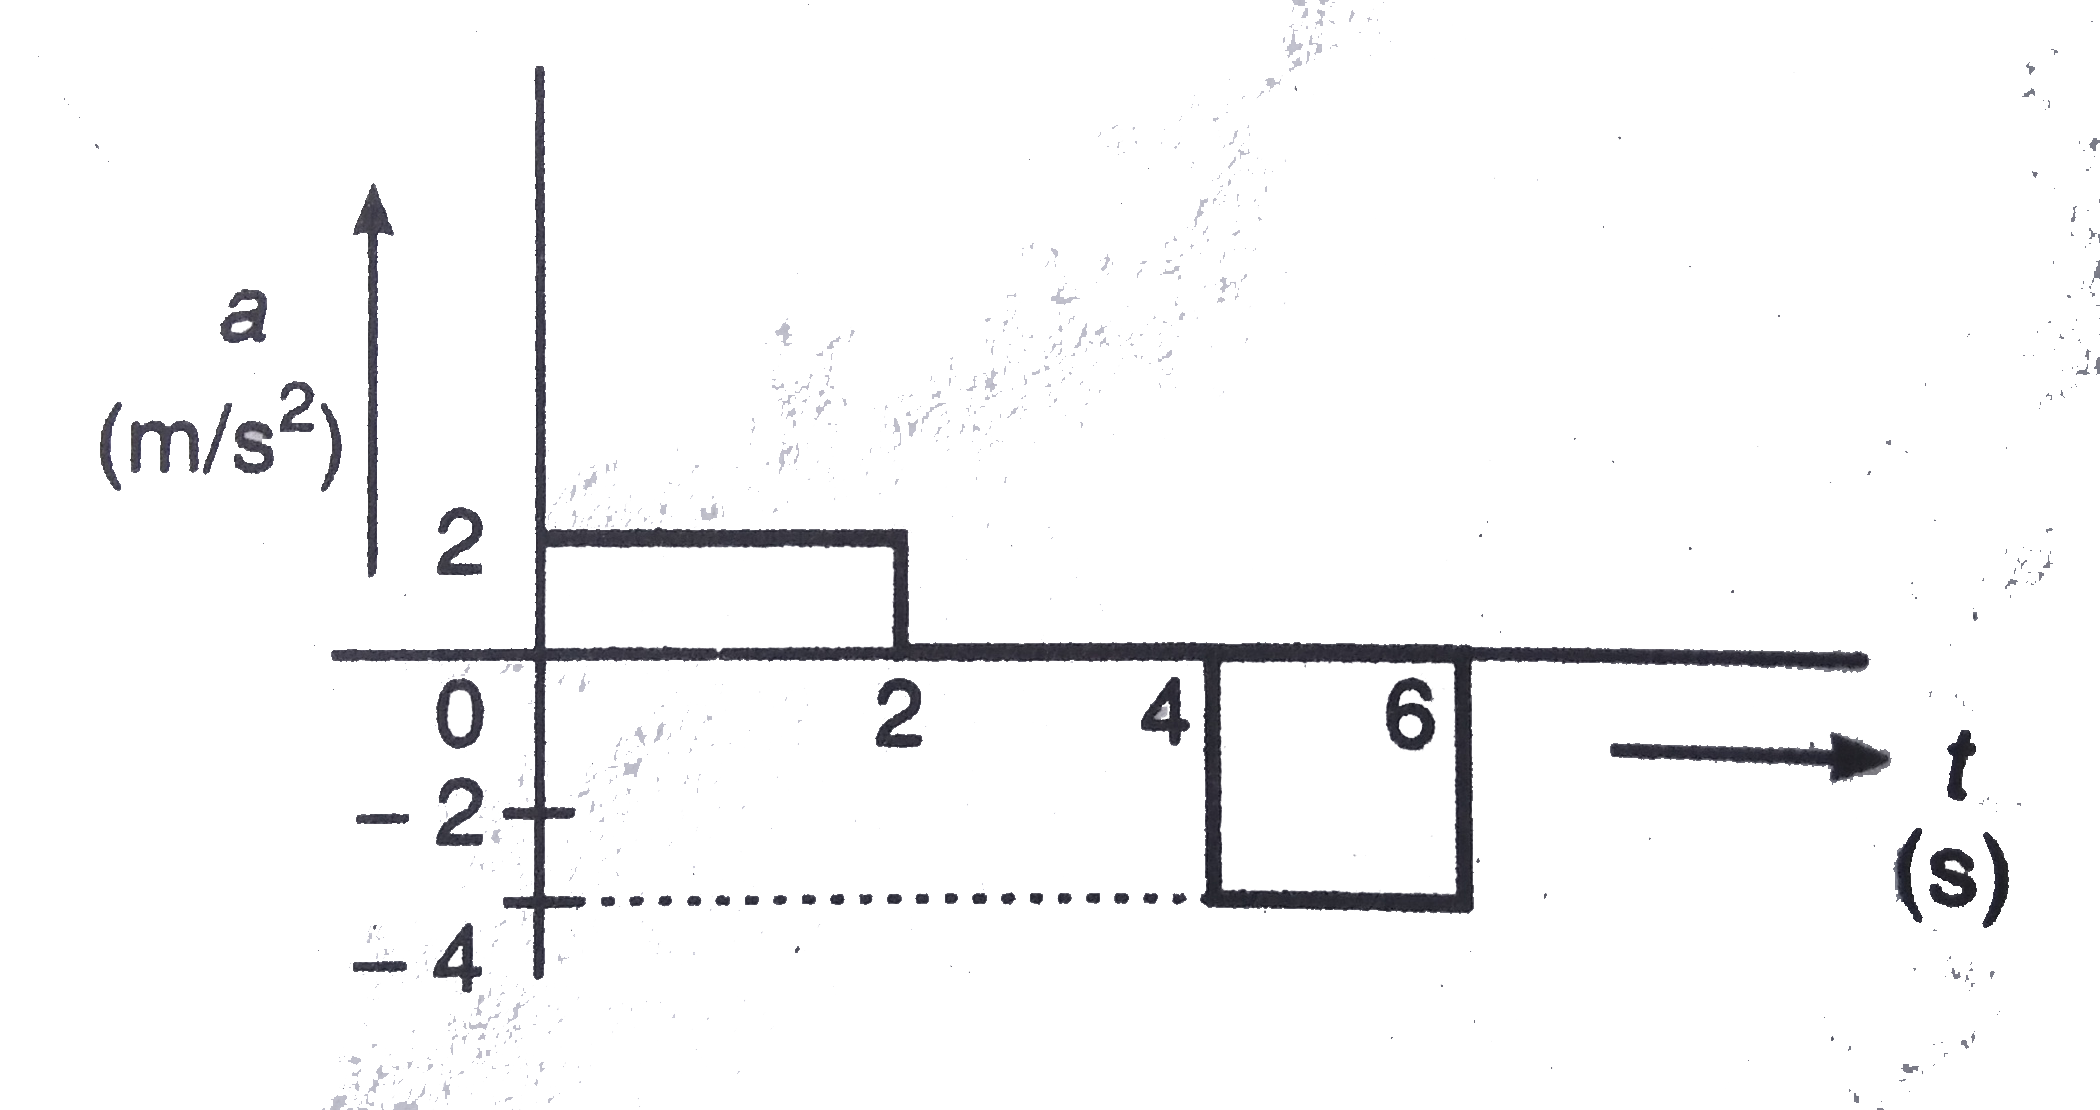
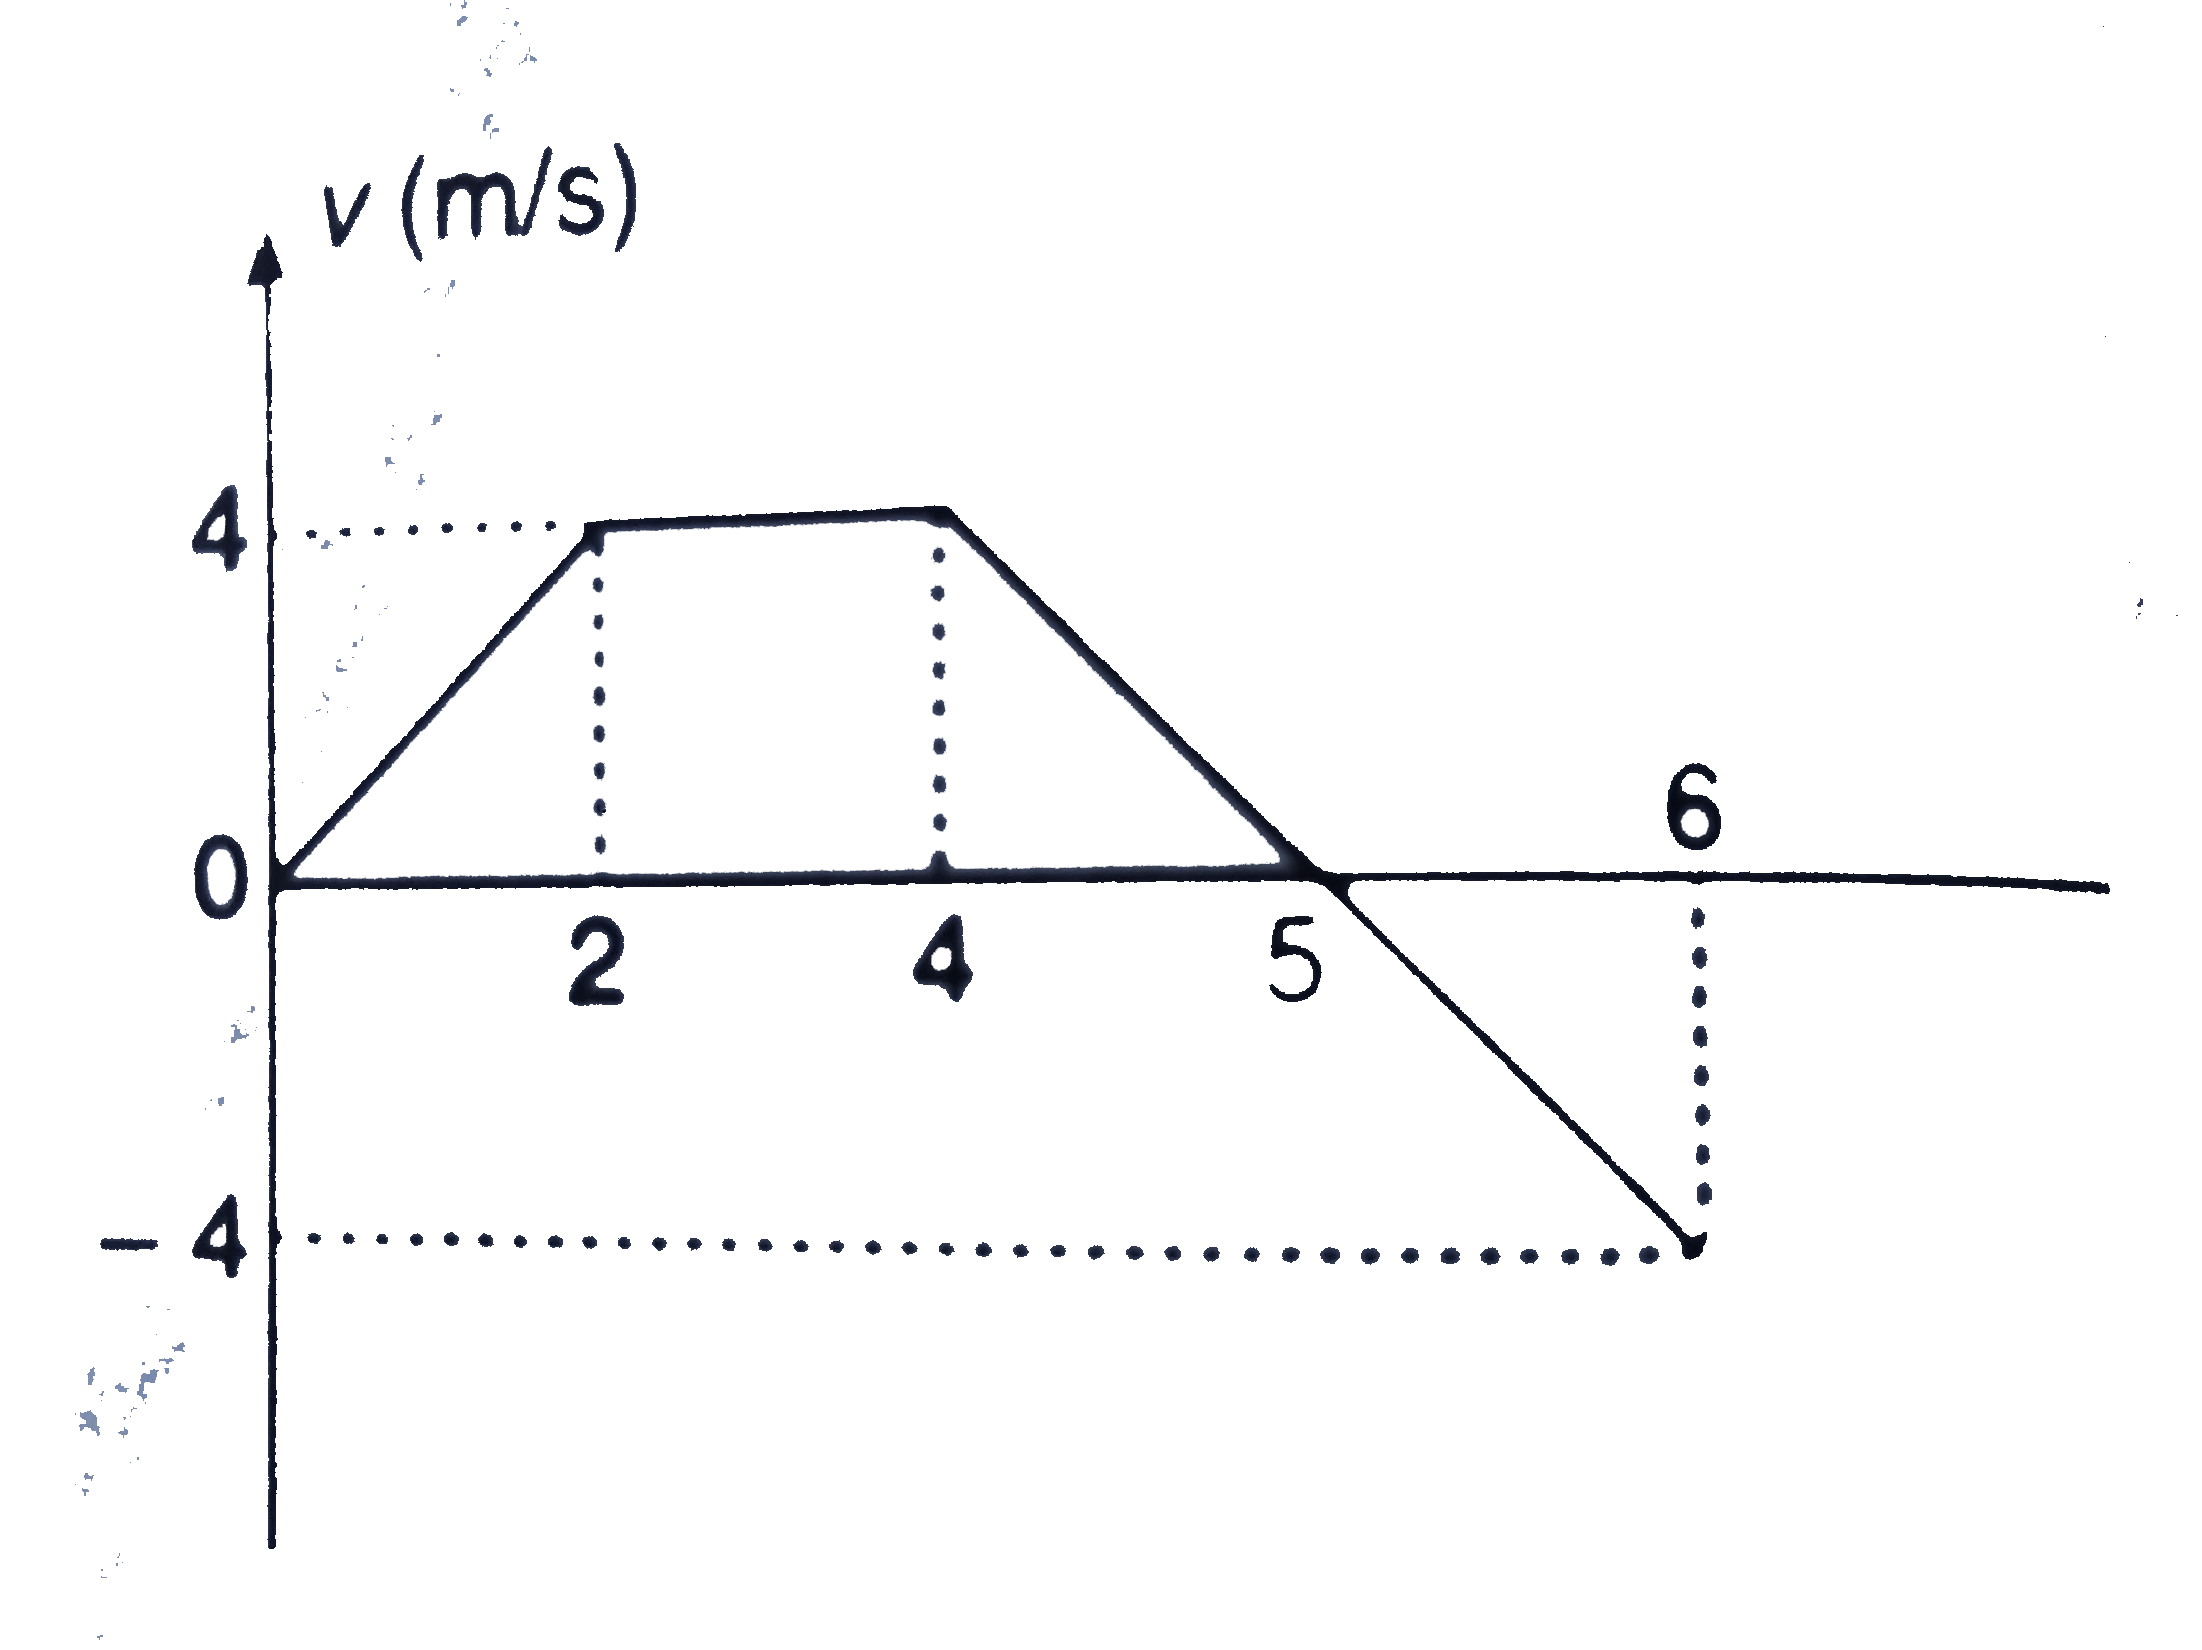
- The acceleration versus time graph of a particle moving along a straig...
Text Solution
|
- A particle is projected with velocity 2(sqrt(gh)), so that it just cle...
Text Solution
|
- Two inclined planes AB and BC are at inclinations of 60^(@) and 30^(@)...
Text Solution
|
- A particle moves along a parabolic path y=-9x^(2) in such a way that t...
Text Solution
|
- A ground to ground projectile is at point A at t = (T)/(3), is at poin...
Text Solution
|
- An object is projected with a velocitiy of 20m//s making an angle of 4...
Text Solution
|
- A ball is thrown from the ground to clear a wall 3m high at a distance...
Text Solution
|
- A particle is thrown from the origin,at an angle theta(0lttheta lt 90^...
Text Solution
|
- ABC is a triangle in vertical plane. Its two base angles /BAC and /BCA...
Text Solution
|
- A stone is projected from point P on the inclined plane with velocity ...
Text Solution
|
- A stone is thrown from the top of a tower of height h=10m with speed v...
Text Solution
|