 .
.A
B
C
D
Text Solution
Verified by Experts
The correct Answer is:


Topper's Solved these Questions
ALTERNATING CURRENT
DC PANDEY ENGLISH|Exercise Level - 1 Subjective|6 VideosALTERNATING CURRENT
DC PANDEY ENGLISH|Exercise Level- 2 Single Correct|18 VideosALTERNATING CURRENT
DC PANDEY ENGLISH|Exercise Level 1 Assertion-Reason|11 VideosATOMS
DC PANDEY ENGLISH|Exercise MEDICAL ENTRANCES GALLERY|42 Videos
Similar Questions
Explore conceptually related problems
DC PANDEY ENGLISH-ALTERNATING CURRENT-Level - 1 Objective
- The current and voltage functions in an AC circuit are i=100 sin 100...
Text Solution
|
- A capacitor becomes a perfect insulator when the current is
Text Solution
|
- For an alternating voltave V=10 cos 100 pit volt, the instantenous vol...
Text Solution
|
- In a purely resistive AC circuit,
Text Solution
|
- Identify the graph which correctly reperesents the variation of capaci...
Text Solution
|
- In an AC circuit, the impedance is sqrt3 times the reactance, then the...
Text Solution
|
- Voltage applied to an AC circuit and current flowing in it is given by...
Text Solution
|
- A current of 4A flows in a coil when connected to a 12V DC source. If ...
Text Solution
|
- In the circuit shown in figureure, the reading of the AC ammeter is ...
Text Solution
|
- An AC voltage is applied acrss a series combination of L and R. If the...
Text Solution
|
- For wattless power is an AC circuit, the phase angle between the curre...
Text Solution
|
- The correct variation of resistance R with frequency f is given by
Text Solution
|
- If L and R be the inductance and resistance of the choke coil, then in...
Text Solution
|
- When an AC signal of frequency 1 kHz is applied across a coil of resis...
Text Solution
|
- The frequency of an alternating current is 50 Hz. The minimum time tak...
Text Solution
|
- The current and voltage functions in an AC circuit are i=100 sin 100...
Text Solution
|
- In the AC network shown in figureure the rms current flowing through t...
Text Solution
|
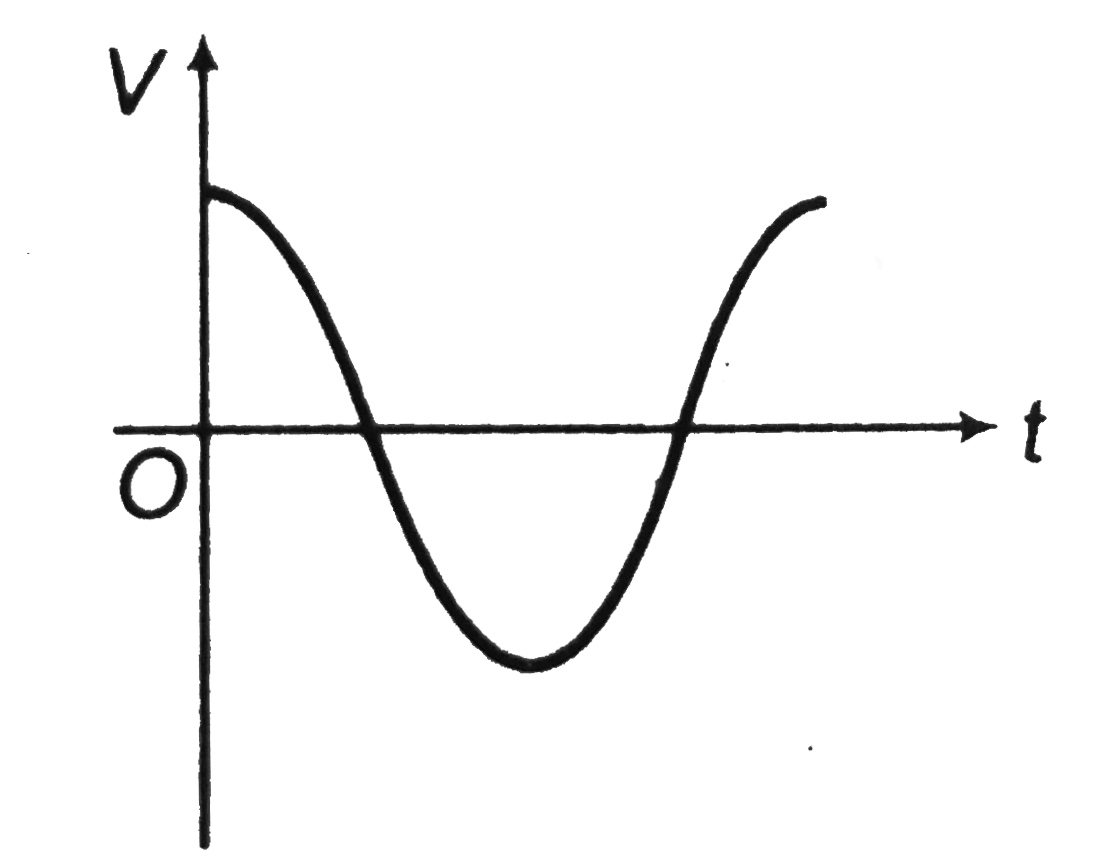
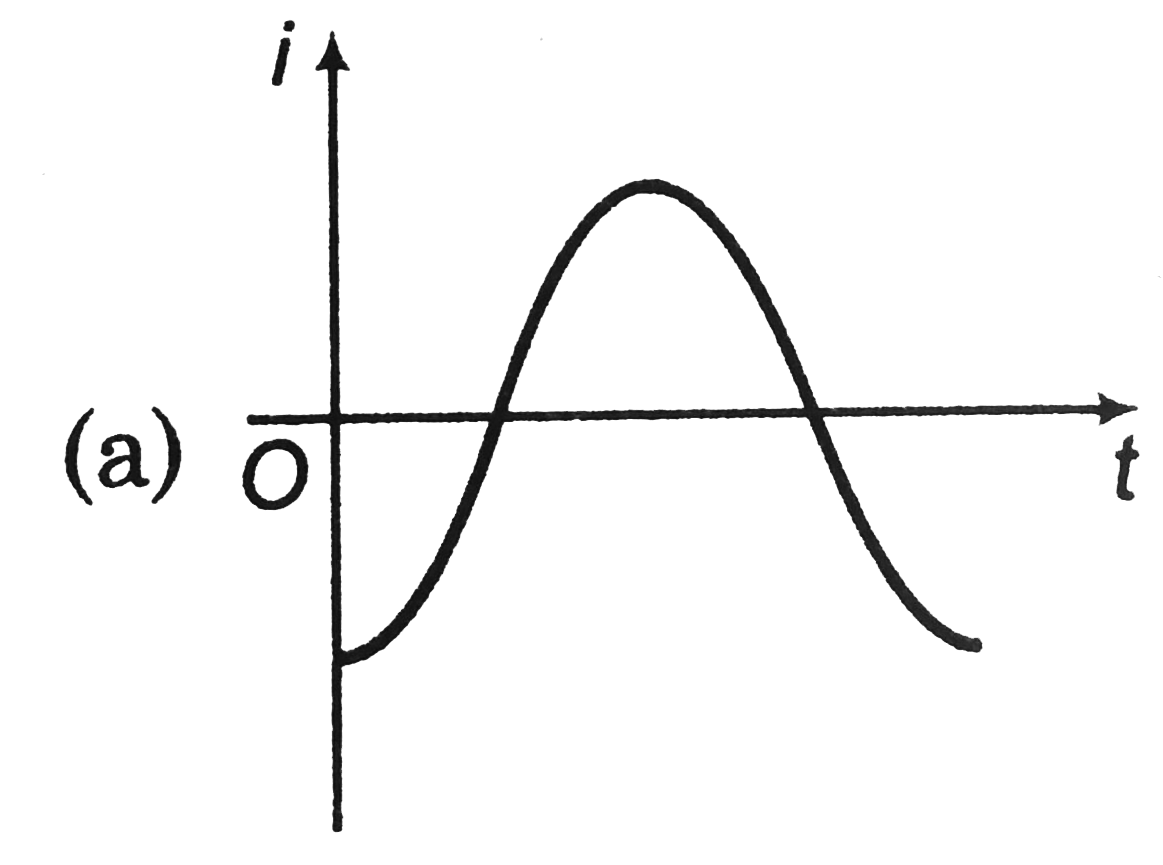
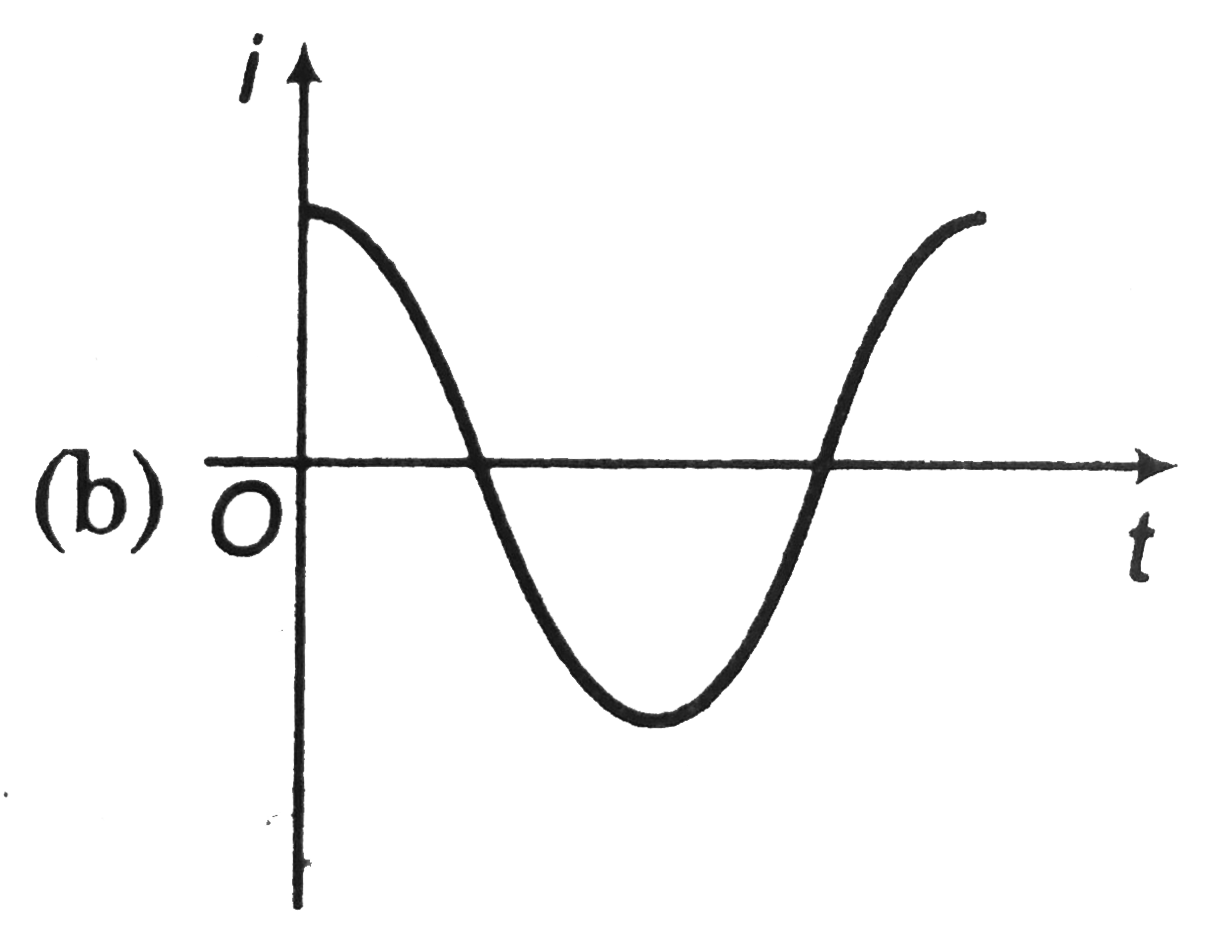
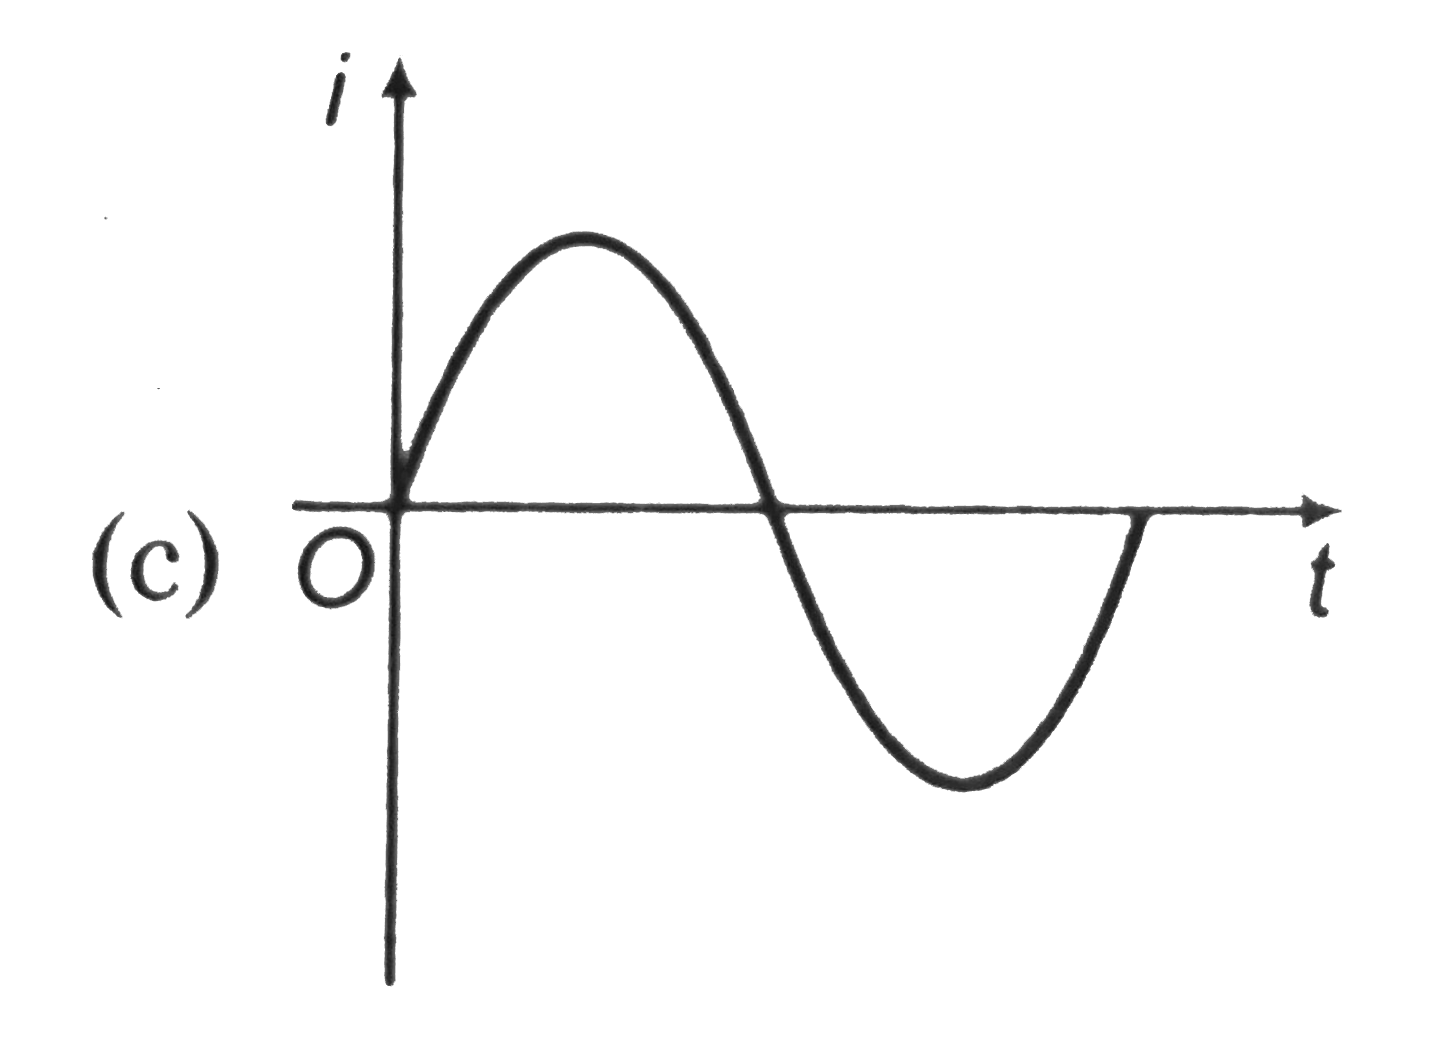
- The figure represents the voltage applied across a pure inductor. The ...
Text Solution
|
- A steady current of magnitude I and an AC current of peak value I are ...
Text Solution
|
- A 50 Hz AC source of 20 V is connected across R and C as shown in fig...
Text Solution
|