Home
Class 11
PHYSICS
The speed -time graph of the ball in the...

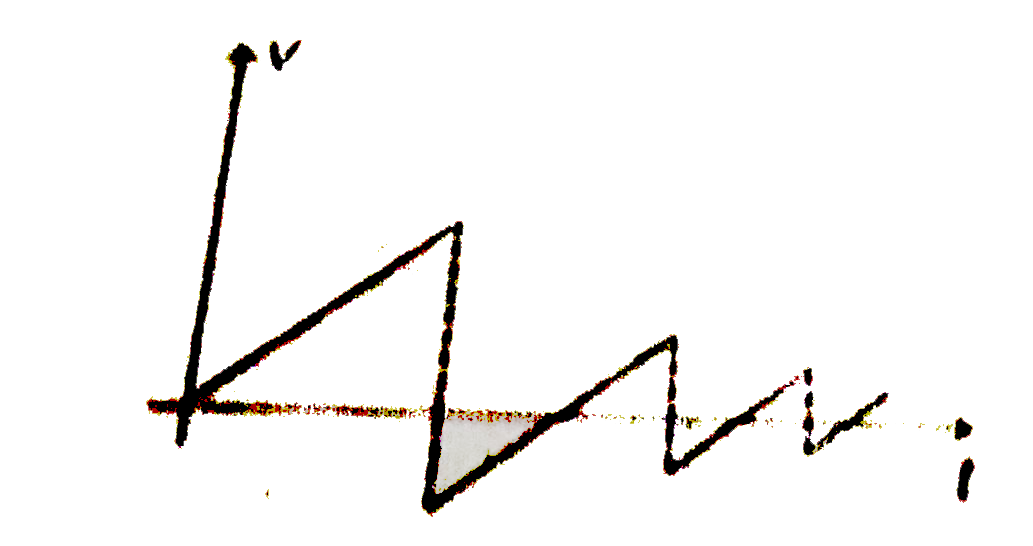
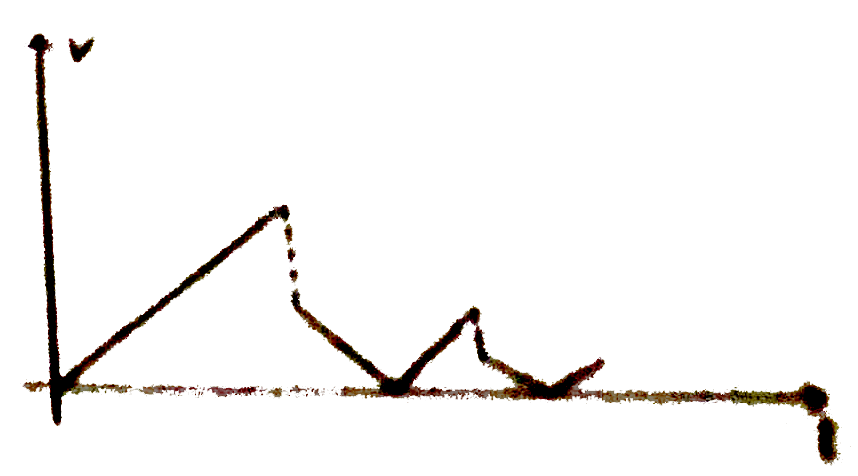
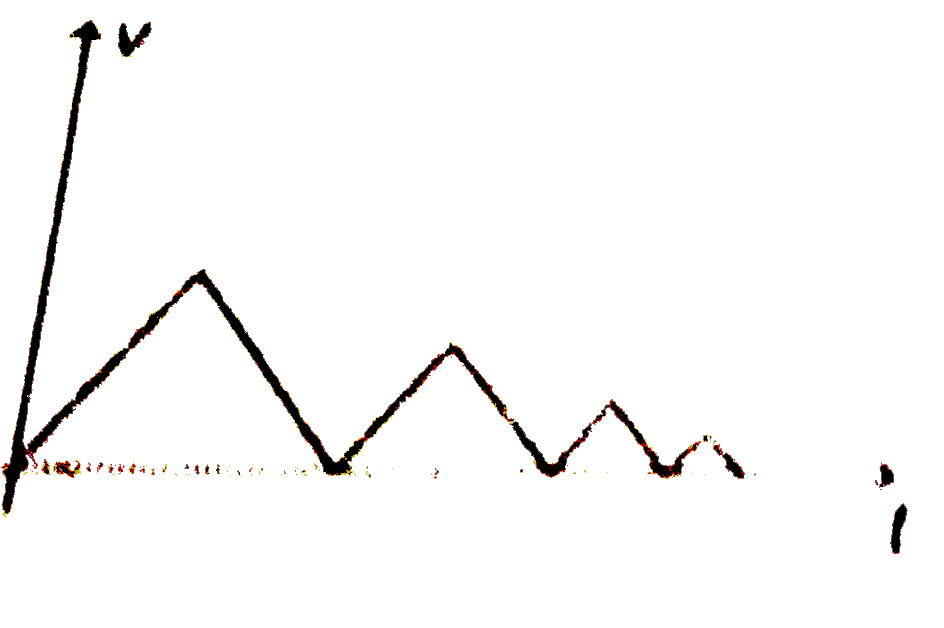
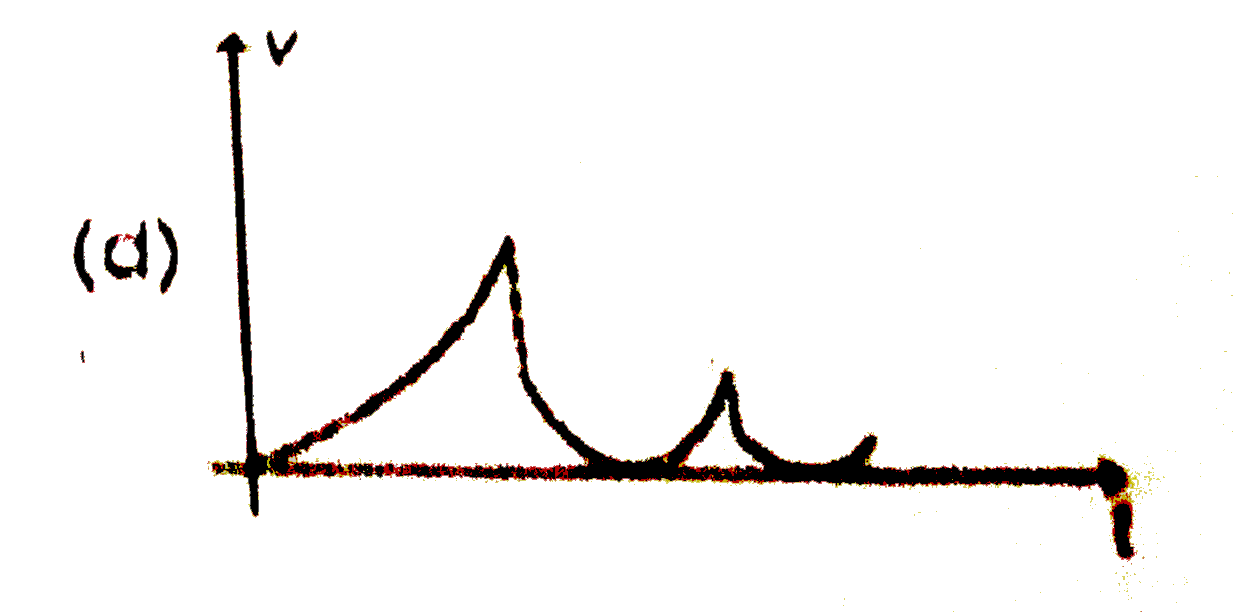
The speed -time graph of the ball in the above situation is.

A

B

C

D

Text Solution

AI Generated Solution

The correct Answer is:
To determine the correct speed-time graph for a ball dropped from a height and bouncing on a horizontal floor with a coefficient of restitution of 1/2, we can analyze the motion step by step. ### Step-by-Step Solution: 1. **Initial Drop**: - The ball is dropped from a height \( h \). - Initially, the speed \( v_0 = 0 \) m/s (the ball is at rest before being dropped). - As it falls, it accelerates downwards due to gravity \( g \) (approximately \( 9.8 \, \text{m/s}^2 \)). - The speed of the ball just before it hits the ground can be calculated using the equation: \[ v_1 = gt \] - The graph will start at the origin (0,0) and rise as the speed increases. 2. **Impact with the Ground**: - Upon hitting the ground, the ball will have a speed \( v_1 \). - Due to the coefficient of restitution \( e = \frac{1}{2} \), the speed after the bounce will be: \[ v_2 = e \cdot v_1 = \frac{1}{2} v_1 \] - This means that the speed decreases after the bounce. 3. **Upward Motion**: - After bouncing, the ball will move upwards, decelerating due to gravity until it reaches its maximum height where its speed becomes 0. - The speed-time graph will show a decrease from \( v_2 \) to 0 as it moves upward. 4. **Second Impact**: - When the ball falls back down, it will again accelerate downwards and hit the ground with a speed \( v_3 \), which will be: \[ v_3 = e \cdot v_2 = e \cdot \left(\frac{1}{2} v_1\right) = \frac{1}{4} v_1 \] - The speed will again increase as it falls back down. 5. **Continued Bouncing**: - This process will continue, with the speed before each impact decreasing due to the coefficient of restitution. - The speeds will follow the pattern: \( v_1, v_2, v_3, v_4 \) where \( v_1 > v_2 > v_3 > v_4 \) and so on. 6. **Graph Characteristics**: - The graph will show a series of peaks (the speeds just before each impact) that get progressively lower. - The segments of the graph will alternate between increasing and decreasing slopes, reflecting the acceleration downwards and the deceleration upwards. ### Conclusion: Based on the analysis, the correct speed-time graph will show: - An initial increase in speed as the ball falls. - A drop in speed after each bounce, with the peaks getting lower each time. - The graph will not cross into negative speed values, as speed cannot be negative in this context. Thus, the correct option for the speed-time graph is **B**.
Promotional Banner

Topper's Solved these Questions

  • KINEMATICS 1

    DC PANDEY ENGLISH|Exercise MCQ_TYPE|27 Videos
  • KINEMATICS 1

    DC PANDEY ENGLISH|Exercise COMPREHENSION_TYPE|19 Videos
  • KINEMATICS

    DC PANDEY ENGLISH|Exercise INTEGER_TYPE|10 Videos
  • LAWS OF MOTION

    DC PANDEY ENGLISH|Exercise Medical entrances gallery|39 Videos

Similar Questions

Explore conceptually related problems

A ball is thrown vertically upwards. Which of the following plots represents the speed-time graph of the ball during its height if the air resistance is ignored ?

A ball is thrown vertically upward.Which of the following plots represents the speed-time graph of the ball during its flight if the air resostance is not ignored?

The x-t graph of a particle moving along a straight line is shown in figure The speed-time graph of the particle is correctly shown by

A ball is thrown vertically upwards. Which of the following graph/graphs represent velocity-time graph of the ball during its flight (air resistance is neglected)

A ball is thrown vertically upwards. Which of the following plots represent the speed graph of the ball during its flight if the air resistence is not ignored?

A ball is thrown vertically upwards. Which of the following plots represent the speed graph of the ball during its flight if the air resistence is not ignored?

Graphs are very useful to represent a physical situation. Various quantities can be easily represented on graphs and other quantites can be determined from the graph. For example the slope of velocity-time graph represents instantaneous acceleration. For a motion with constant acceleration slope of velocity-time graph is constant. If acceleration is changing with time, slope with change and thus velocity-time graph will be a non-linear curve. Further the area of velocity-time graph gives displacement. For the above situation let t_(1) be the time of accelerated motion and t_(2) be the time or retarded motion, then the correct relation is

A ball is dropped from a certain height on a horizontal floor. The coefficient of restitution between the ball and the floor is (1)/(2) . The displacement time graph of the ball will be.

a. A ball is thrown vertically upwards. Aftre some time it trturns to the throuer. Draw the velocity-time graph and speed-time graph. b. A ball is dropped from some height. After rebounding from the floor, it ascends to the same height. Draw the velocity-time graph and speed-time graph.

A ball is dropped from a height of 80 m on a floor. At each collision, the ball loses half of its speed. Plot the speed-time graph and velocity-time graph of its motion till two collisions With the floor. [Take g=10 m//s^2 ]