A
B
C
D
Text Solution
Verified by Experts
The correct Answer is:


Topper's Solved these Questions
Similar Questions
Explore conceptually related problems
DC PANDEY ENGLISH-CURRENT ELECTRICITY-All Questions
- Gas at a pressure P(0) in contained as a vessel. If the masses of all ...
Text Solution
|
- A cylindrical tube of uniform cross-sectional area A is fitted with tw...
Text Solution
|
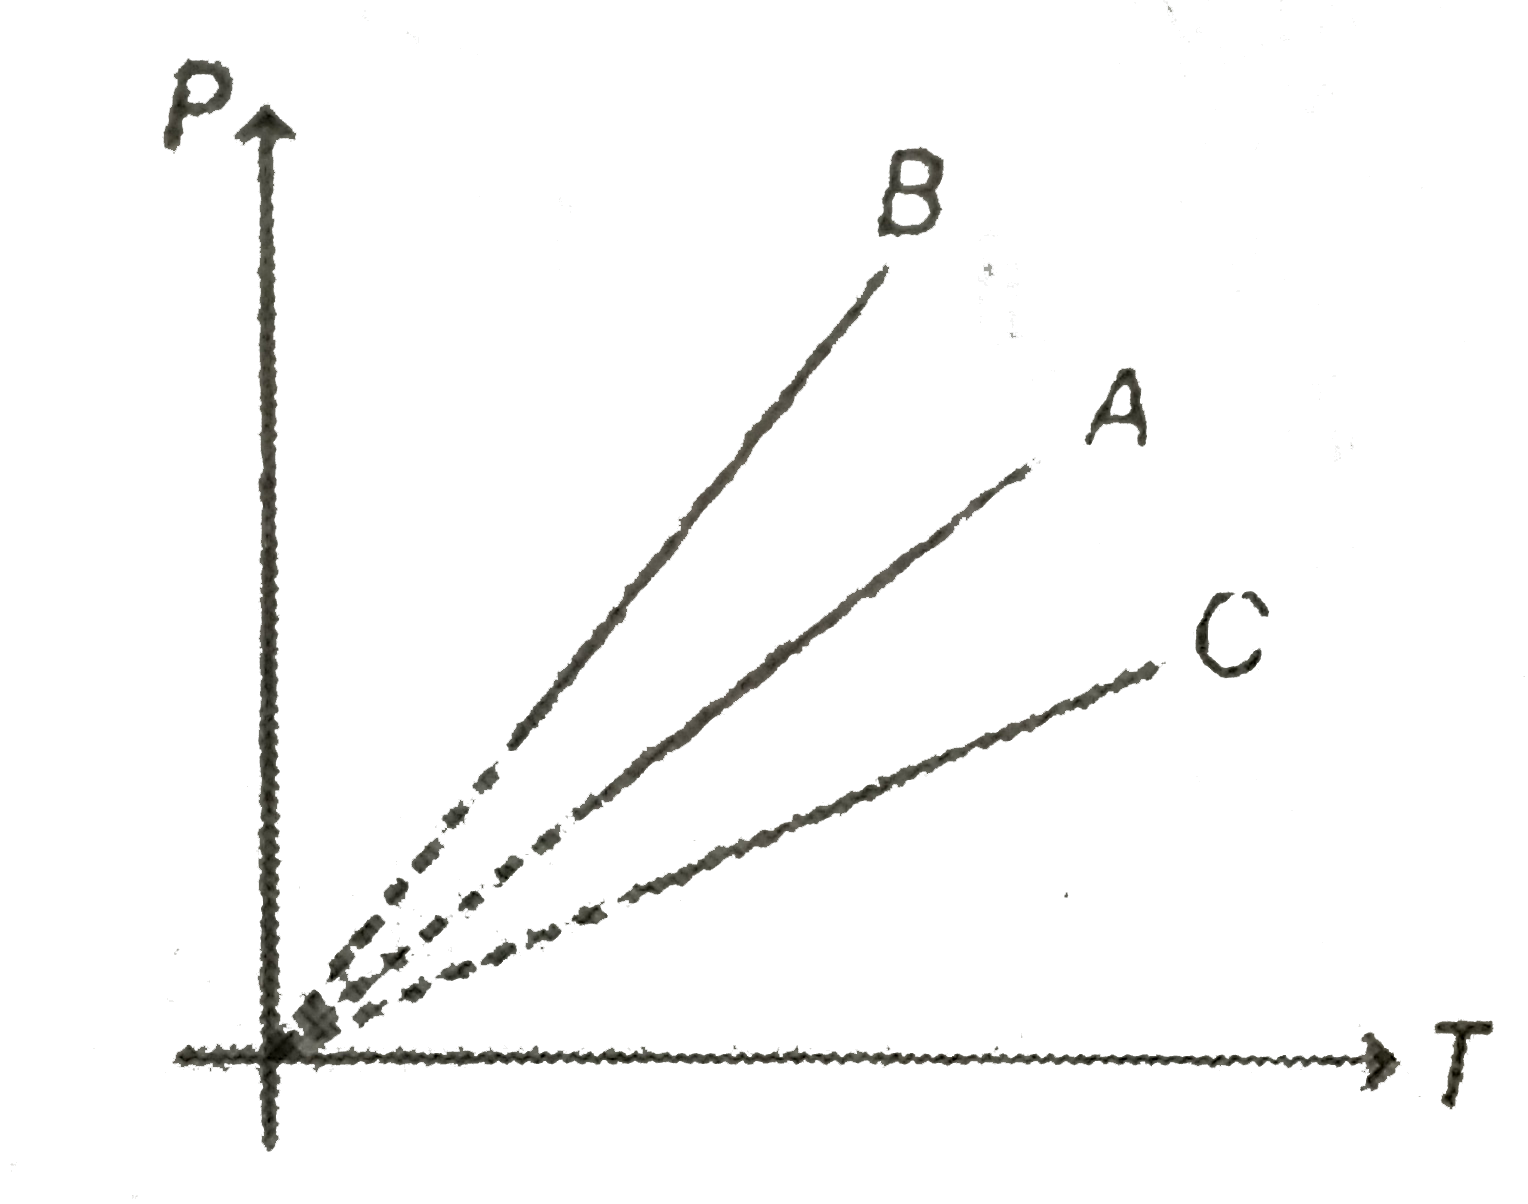
- Pressure versus temperature graph of an ideal gas at constant volume V...
Text Solution
|
- The temperature of a gas contained in a closed vessel increases by 1^(...
Text Solution
|
- P - V diagram of an ideal gas is as shown in figure. Work done by the ...
Text Solution
|
- For an ideal monoatomic gas, the universal gas constant R is n times t...
Text Solution
|
- If gas molecules undergo, inelastic collision with the walls of the co...
Text Solution
|
- Pressure versus temperature graph of an ideal gas of equal number of a...
Text Solution
|
- In the P-V diagram shown in figure ABC is a semicircle. The work done ...
Text Solution
|
- Six identical cunducting rods are joined as shown in Fig. Points A and...
Text Solution
|
- A thermodynamic system undergoes cyclic process ABCDA as shown in figu...
Text Solution
|
- At room temperature, the rms speed of the molecules of a certain diato...
Text Solution
|
- 70 calories of heat is required to raise the temperature of 2 mole of ...
Text Solution
|
- If one mole of a mono-atomic gas (gamma=5//3) is mixed with one mole o...
Text Solution
|
- A cylinder of radius R made of a material of thermal conductivity K1 i...
Text Solution
|
- The temperature of an ideal gas is increased from 120 K to 480 K. If a...
Text Solution
|
- A spherical black body with a radius of 12 cm radiates 450 watt power ...
Text Solution
|
- A faulty thermometer reads 5^@ C melting ice and 99^@ C in steam. Find...
Text Solution
|
- The efficiency of a Carnot's engine at a particular source and sink te...
Text Solution
|
- What must be the lengths of steel and copper rods at 0^(@)C for the di...
Text Solution
|