Home
Class 12
PHYSICS
At time t=0, some radioactive gas is inj...

At time `t=0`, some radioactive gas is injected into a sealed vessel. At time `T`, some more of the same gas is injected into the same vessel. Which one of the following graphs best represents the variation of the logarithm of the activity `A` of the gas with time `t`?

A

B

C

D

Text Solution

AI Generated Solution

The correct Answer is:
To solve the problem, we need to analyze the behavior of the activity \( A \) of a radioactive gas over time after two injections of gas into a sealed vessel. We will derive the relationship between the logarithm of the activity \( \ln A \) and time \( t \). ### Step-by-Step Solution: 1. **Understanding Radioactive Decay**: The activity \( A \) of a radioactive substance is given by the equation: \[ A(t) = A_0 e^{-\lambda t} \] where \( A_0 \) is the initial activity, \( \lambda \) is the decay constant, and \( t \) is time. 2. **Taking the Natural Logarithm**: To analyze the relationship in logarithmic terms, we take the natural logarithm of both sides: \[ \ln A(t) = \ln A_0 - \lambda t \] This equation represents a straight line with a negative slope. 3. **Behavior at Time \( t = 0 \)**: At \( t = 0 \), the activity is at its maximum, \( A(0) = A_0 \). Thus, \( \ln A(0) = \ln A_0 \). 4. **Second Injection at Time \( T \)**: At time \( T \), when more gas is injected, the total activity will increase due to the additional radioactive gas. Let’s denote the new activity after the second injection as \( A_1 \). The activity will still decay but will start from a new initial value: \[ A_1(t) = A_0 e^{-\lambda (t-T)} + A_2 e^{-\lambda (t-T)} \] where \( A_2 \) is the activity contributed by the newly injected gas. 5. **Logarithmic Representation After Second Injection**: After the second injection, the logarithmic activity can be represented as: \[ \ln A(t) = \ln(A_0 + A_2 e^{-\lambda (t-T)}) - \lambda t \] This indicates that after time \( T \), the logarithm of the activity will show a different slope due to the contribution of the newly injected gas. 6. **Graphical Representation**: The graph of \( \ln A \) versus \( t \) will show a linear decrease until time \( T \), and after \( T \), it will show a different linear decrease, indicating a change in slope. The first part of the graph will have a slope of \( -\lambda \), and after \( T \), it will have a different slope, reflecting the new activity level. ### Conclusion: The correct graph will show a linear decrease in \( \ln A \) until \( t = T \) and then a different linear decrease after \( T \). The graph that best represents this behavior is option B.
Promotional Banner

Topper's Solved these Questions

  • MODERN PHYSICS

    DC PANDEY ENGLISH|Exercise for JEE Advanced (More than One Options is Correct )|1 Videos
  • MODERN PHYSICS

    DC PANDEY ENGLISH|Exercise Metch the column|6 Videos
  • MODERN PHYSICS

    DC PANDEY ENGLISH|Exercise Integer Type Questions|17 Videos
  • MAGNETISM AND MATTER

    DC PANDEY ENGLISH|Exercise Medical gallery|1 Videos
  • MODERN PHYSICS - 1

    DC PANDEY ENGLISH|Exercise Level 2 Subjective|23 Videos

Similar Questions

Explore conceptually related problems

The graph shown the variation with times t of the velocity v of an object . Which one of the following graphs best represents the variation of acceleration a of the object with time t ?

Which of the following graph(s) represent retardation ? [v : velocity, t : time, x : position]

Which of the following x-t graphs represents the distance-time variation of a body released from the top of a buiding?

The magnetic flux through a coil varies with timet as shown in the diagram. Which graph best represents the variation of the e.m.f. E induced in the coil with time t?

An alternating current I in an inductance coil varies with time t according to the graph as shown: Which one of the following graph gives the variation of voltage with time?

An alternating current I in an inductance coil varies with time t according to the graph as shown: Which one of the following graph gives the variation of voltage with time?

The given curve represents the variation of temperatue as a function of volume for one mole of an ideal gas. Which of the following curves best represents the variation of pressure as a function of volume ? .

The given curve represents the variation of temperatue as a function of volume for one mole of an ideal gas. Which of the following curves best represents the variation of pressure as a function of volume ? .

The given curve represents the variation of temperature as a function of volume for one mole of an ideal gas. Which of the following curves best represents the variation of pressure as a function of volume?

The given curve represents the variation of temperature as a function of volume for one mole of an ideal gas. Which of the following curves best represents the variation of pressure as a function of volume?

DC PANDEY ENGLISH-MODERN PHYSICS-for JEE Advanced (only one option is Correct)
  1. In the Bohr model of a hydrogen atom, the centripetal force is furnish...

    Text Solution

    |

  2. Average life ofa radioactive sample is 4 ms Initially the total numbe...

    Text Solution

    |

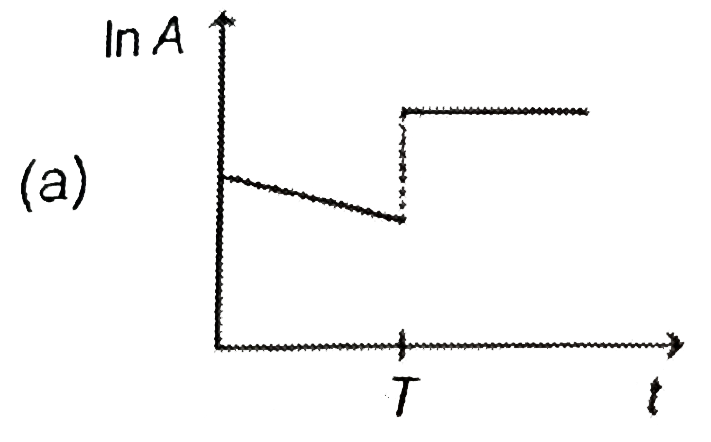
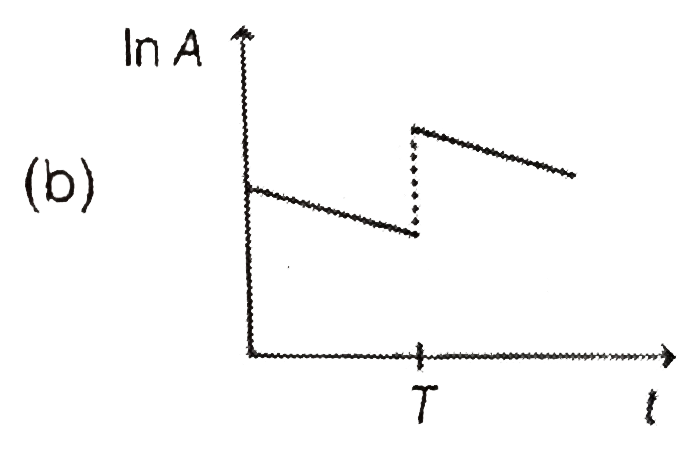
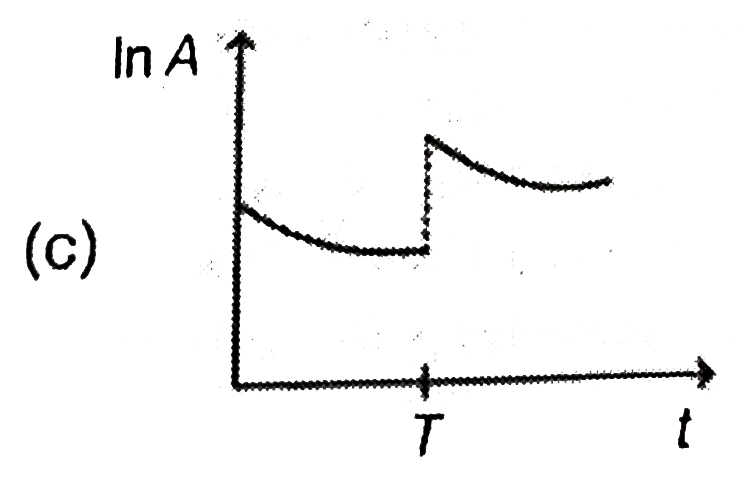
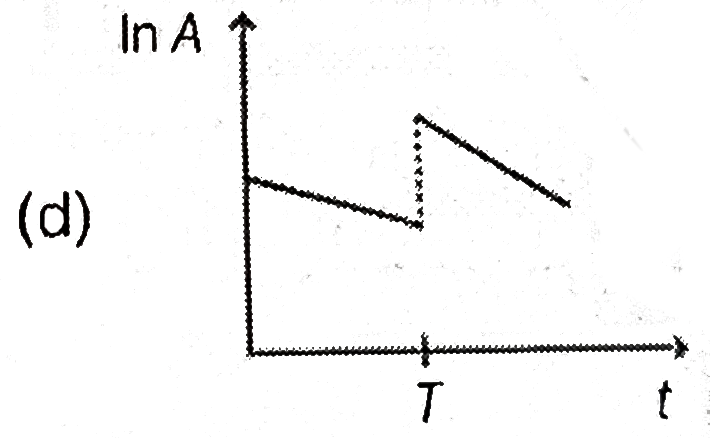
  3. At time t=0, some radioactive gas is injected into a sealed vessel. At...

    Text Solution

    |

  4. A sample of radioactive material has mass m, decay constant lambda, an...

    Text Solution

    |

  5. Binding energy per nucleon for C^(12) is 7.68 MeV and for C^(13) is 7....

    Text Solution

    |

  6. Light coming from a discharge tube filled with hydrogen falls on the c...

    Text Solution

    |

  7. In a hypothetical system , a partical of mass m and charge -3 q is mov...

    Text Solution

    |

  8. In a certain nuclear reactor, a radioactive nucleus is bieng produced ...

    Text Solution

    |

  9. In a hypothetical atom, potential energy between electron and proton a...

    Text Solution

    |

  10. A freshly prepared smaple contains 16xx10^(20) raadioactive nuclei, wh...

    Text Solution

    |

  11. Consider a nuclear reaction : Aoverset(lambda(1))rarrB+C and Bove...

    Text Solution

    |

  12. Two particles A and B have de-Broglie's wavelength 30Å combined to fro...

    Text Solution

    |

  13. The only source of energy in a particular star is the fusion reaction ...

    Text Solution

    |

  14. The de-Broglie wavlength of an electron emitted fromt the ground state...

    Text Solution

    |

  15. An electron and a proton are separated by a large distance and the ele...

    Text Solution

    |

  16. If light of wavelength of maximum intensity emitted from surface at te...

    Text Solution

    |

  17. When photon of wavelength lambda(1) are incident on an isolated shere ...

    Text Solution

    |

  18. The ground state and first excited state energies of hydrogen atom are...

    Text Solution

    |

  19. An electron is excited from a lower energy state to a higher energy st...

    Text Solution

    |

  20. The electron in a hydrogen atom makes a transition n(1) rarr n(2), whe...

    Text Solution

    |